Cluster-based permutation testing

(for EEG)

Dr Germano Gallicchio

Lecturer

School of Sport Science, Bangor University, UK

profile | research | software | learning resources


CuttingGardens 2026 — Bangor Garden

On a computer press F11 to de/activate full-screen view.

QR code to
these slides:

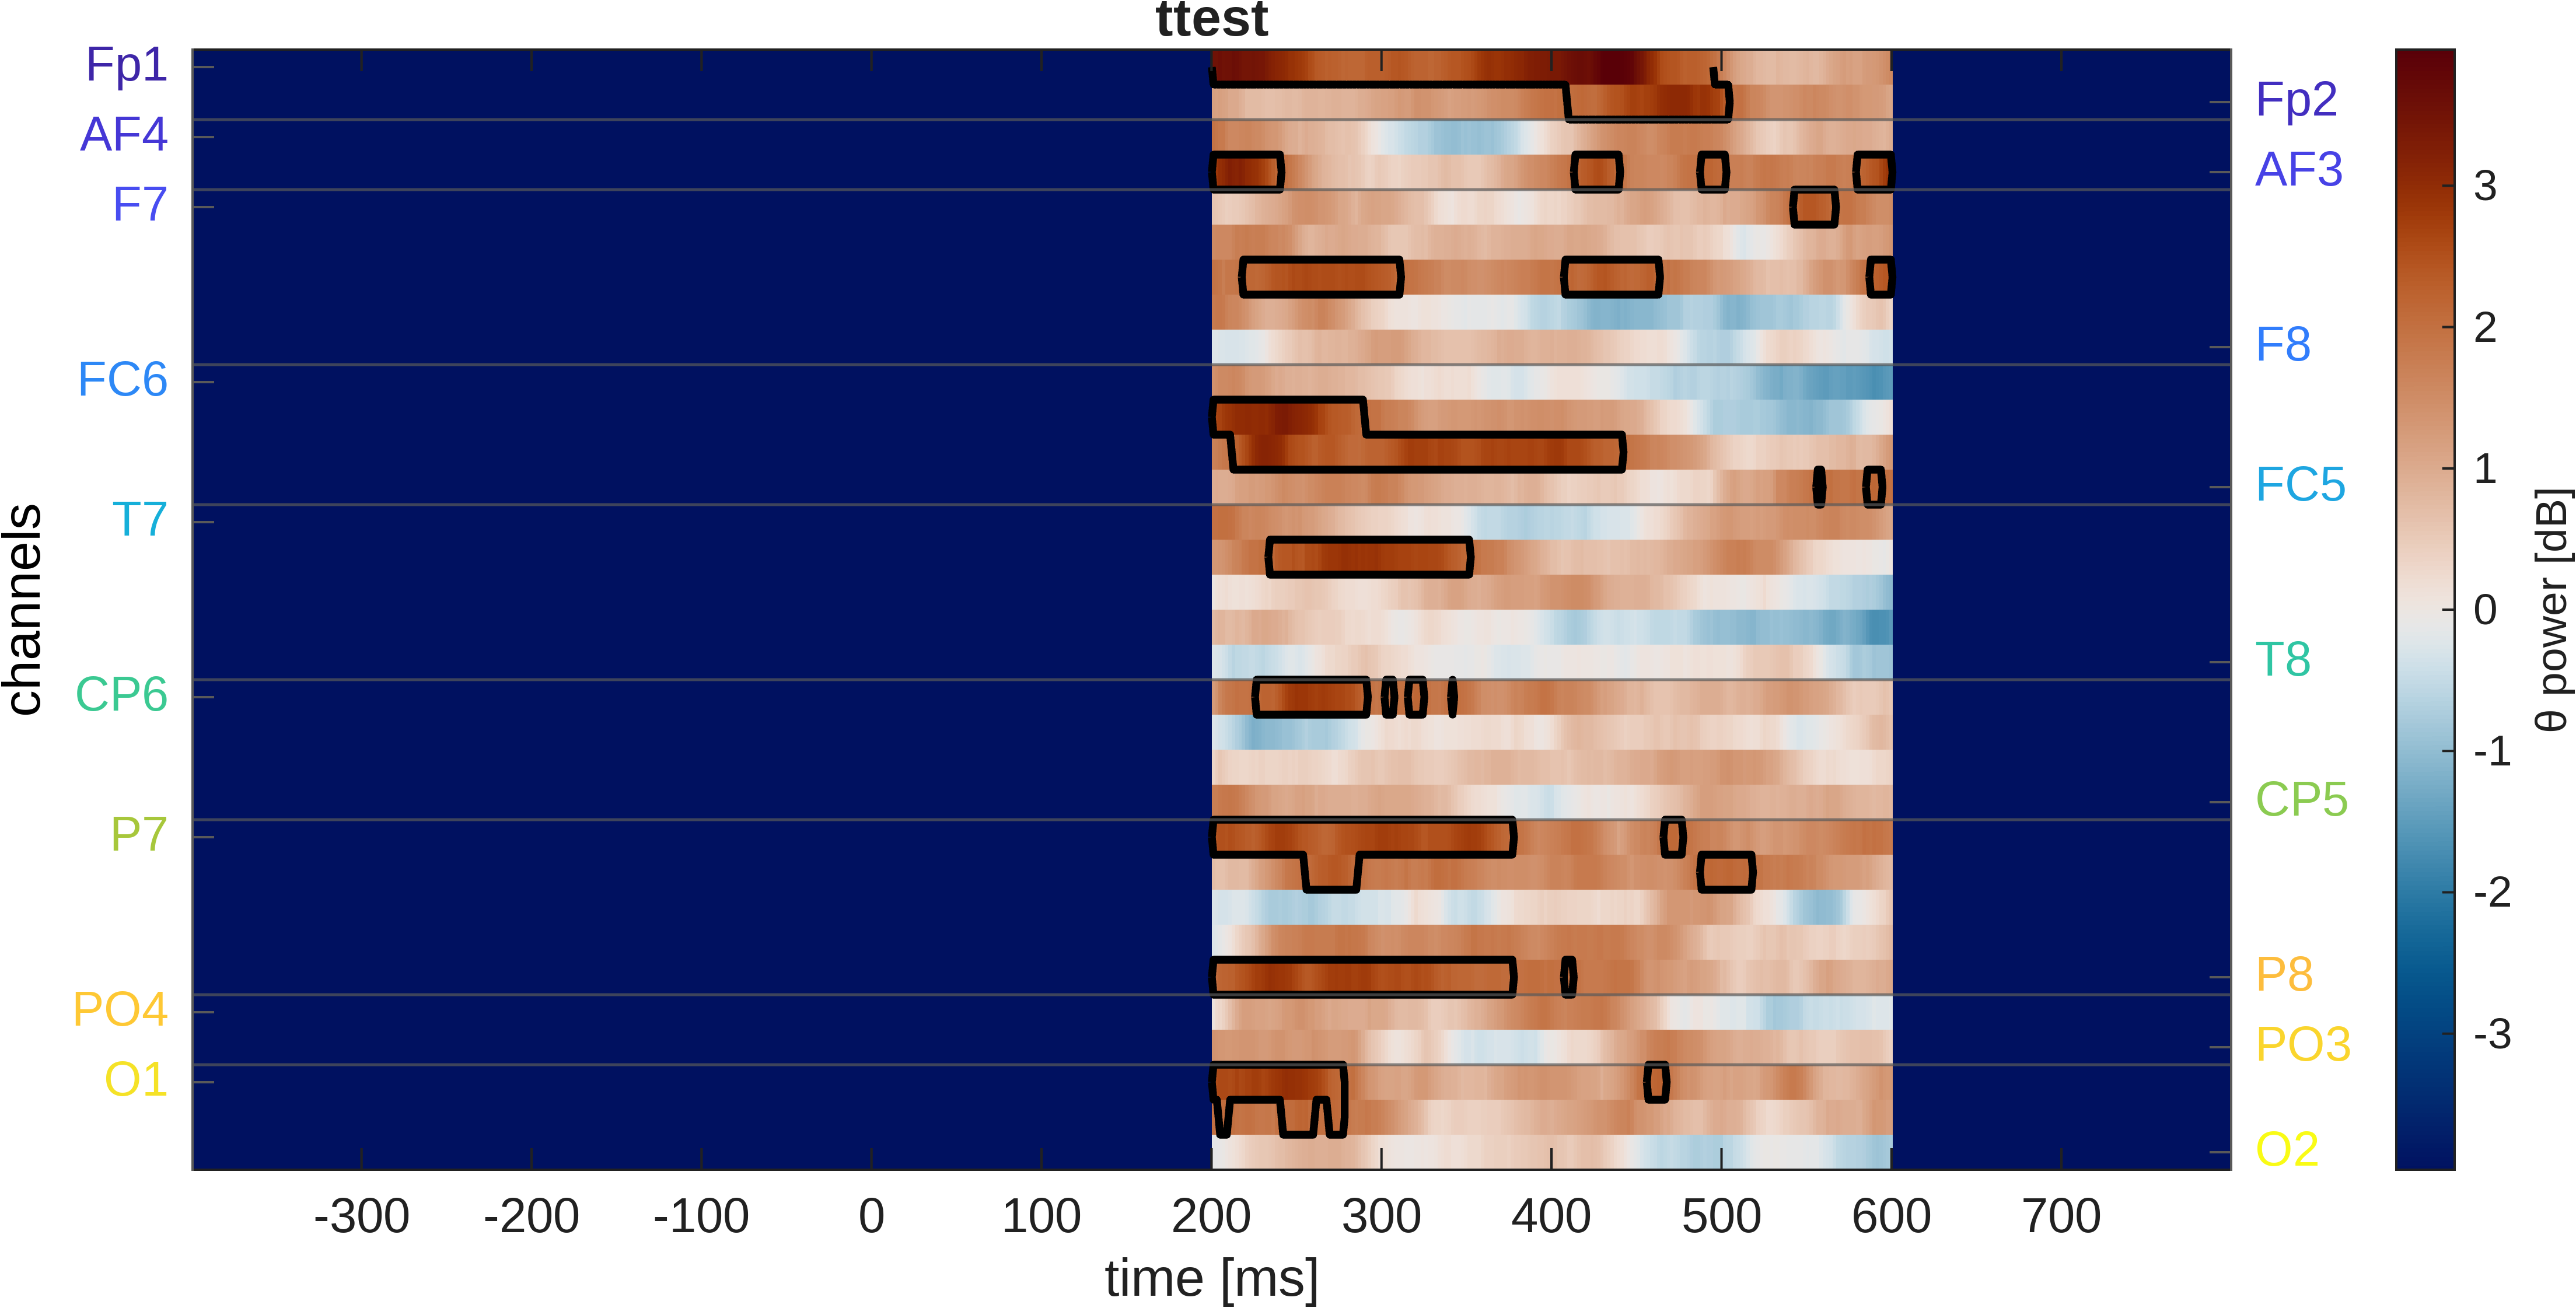
A lot of data (waveforms)
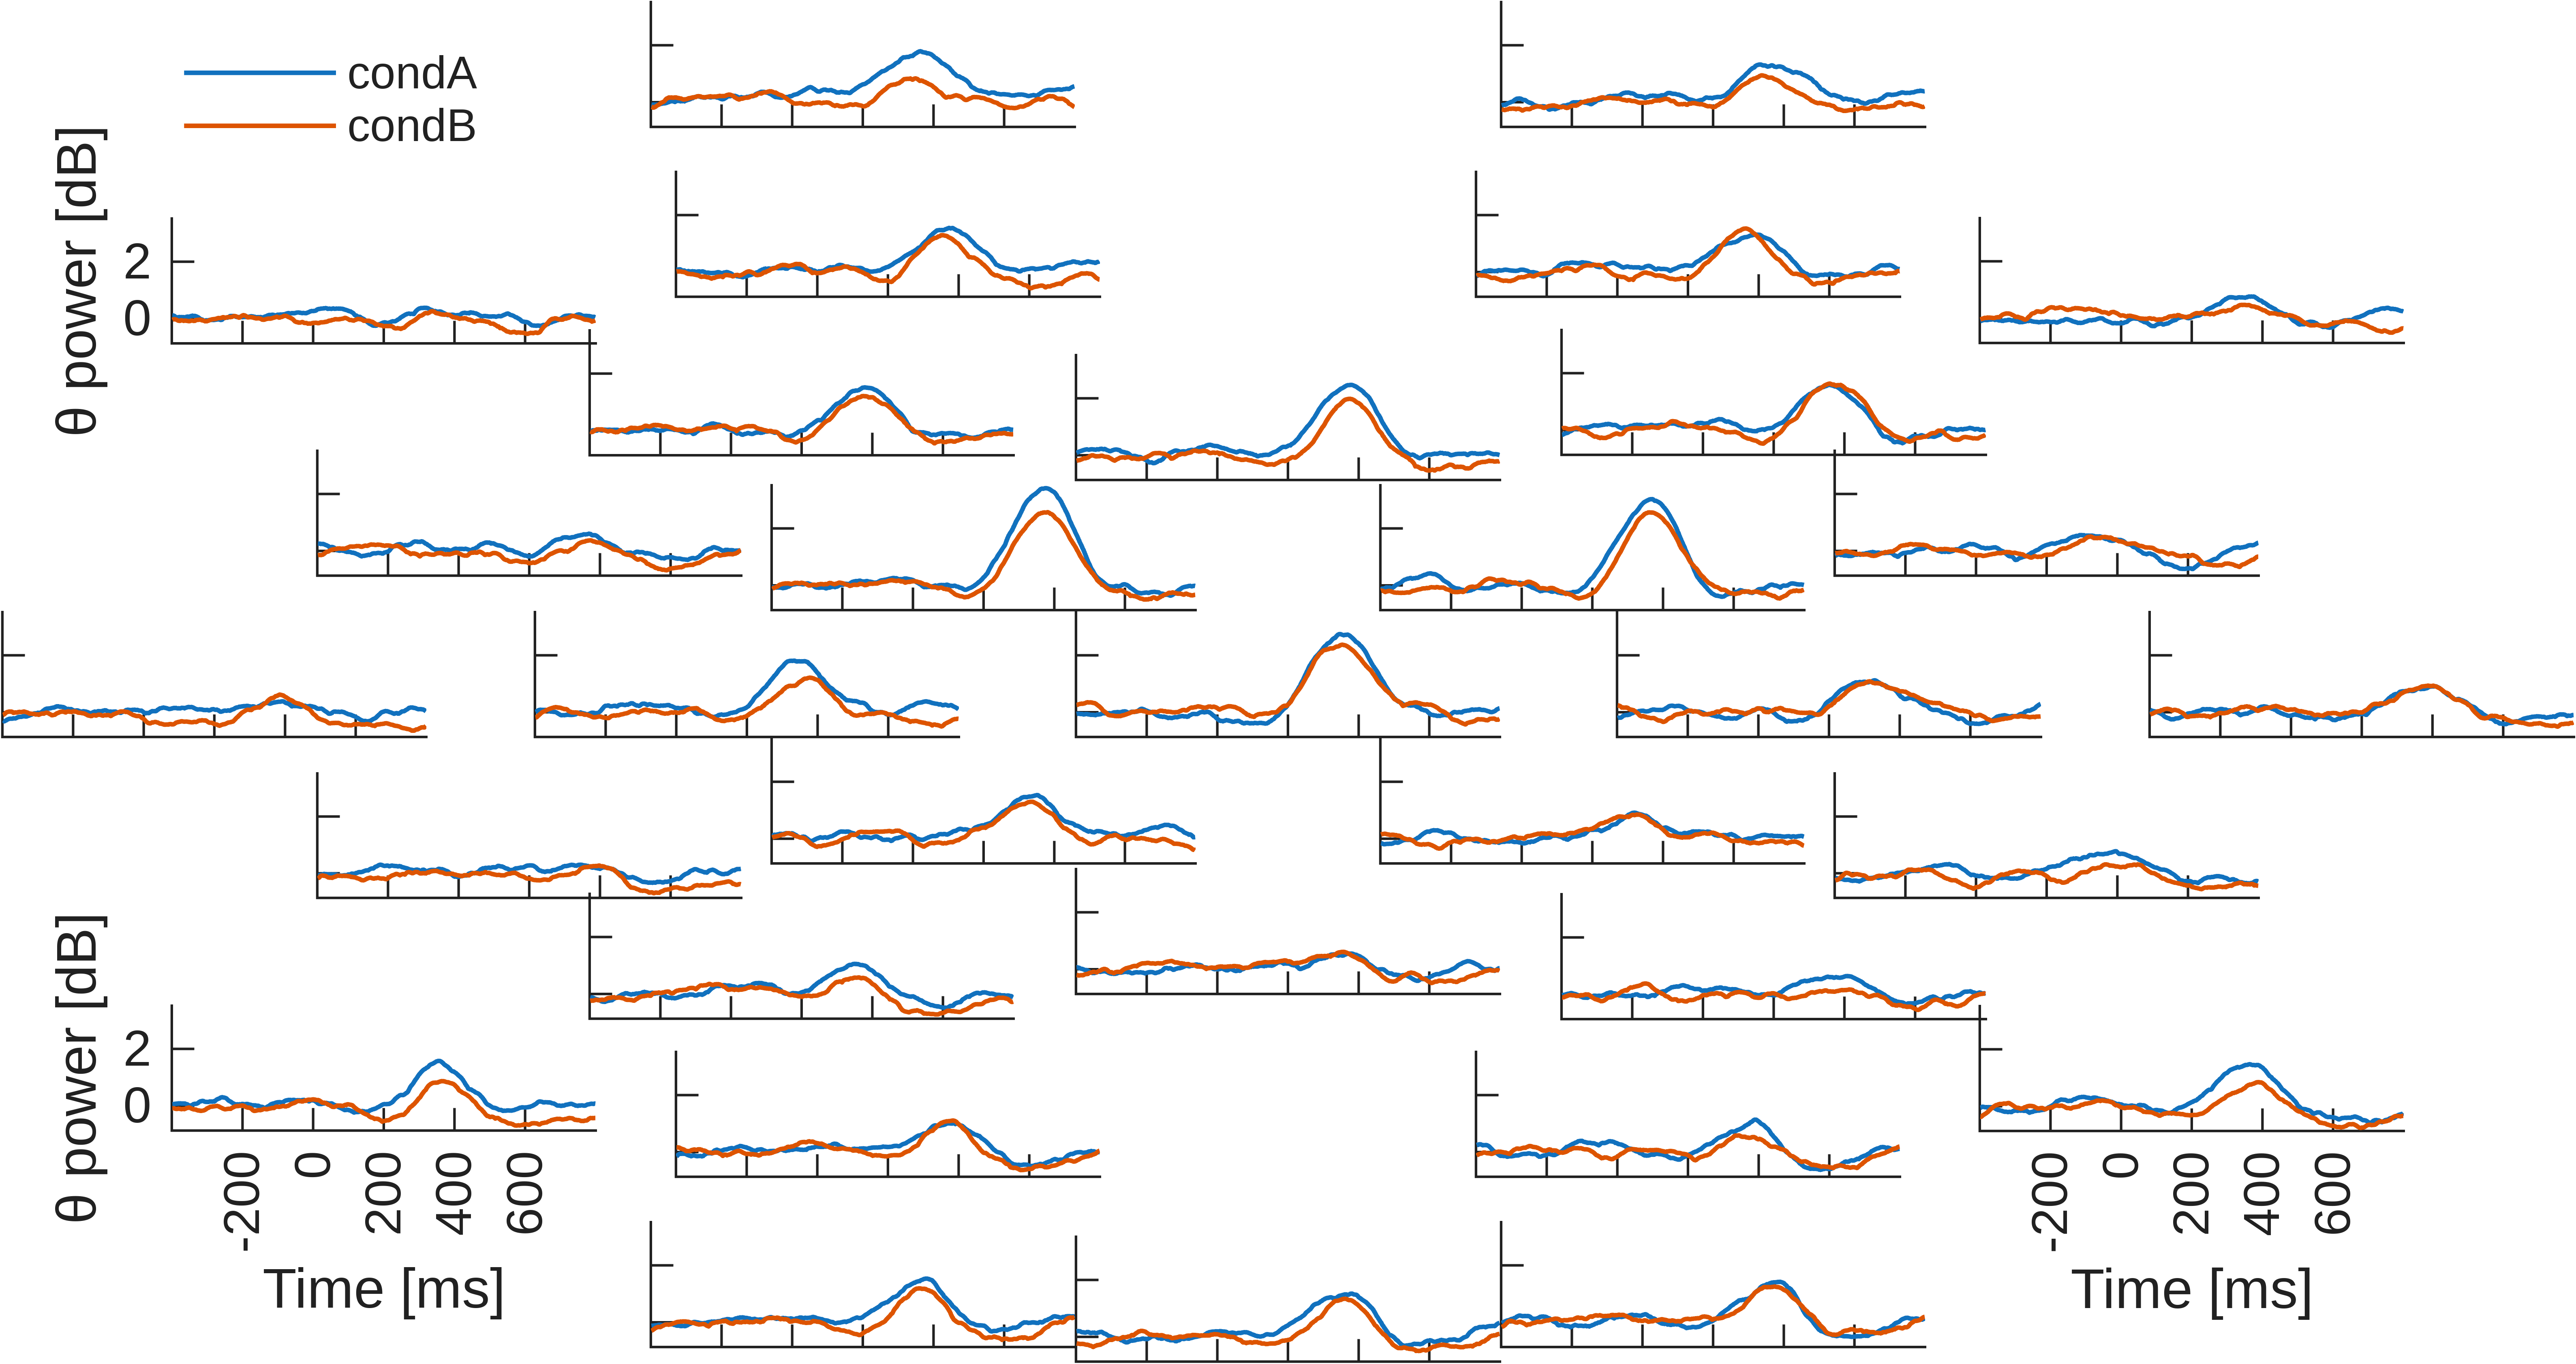
A lot of data (grid view)
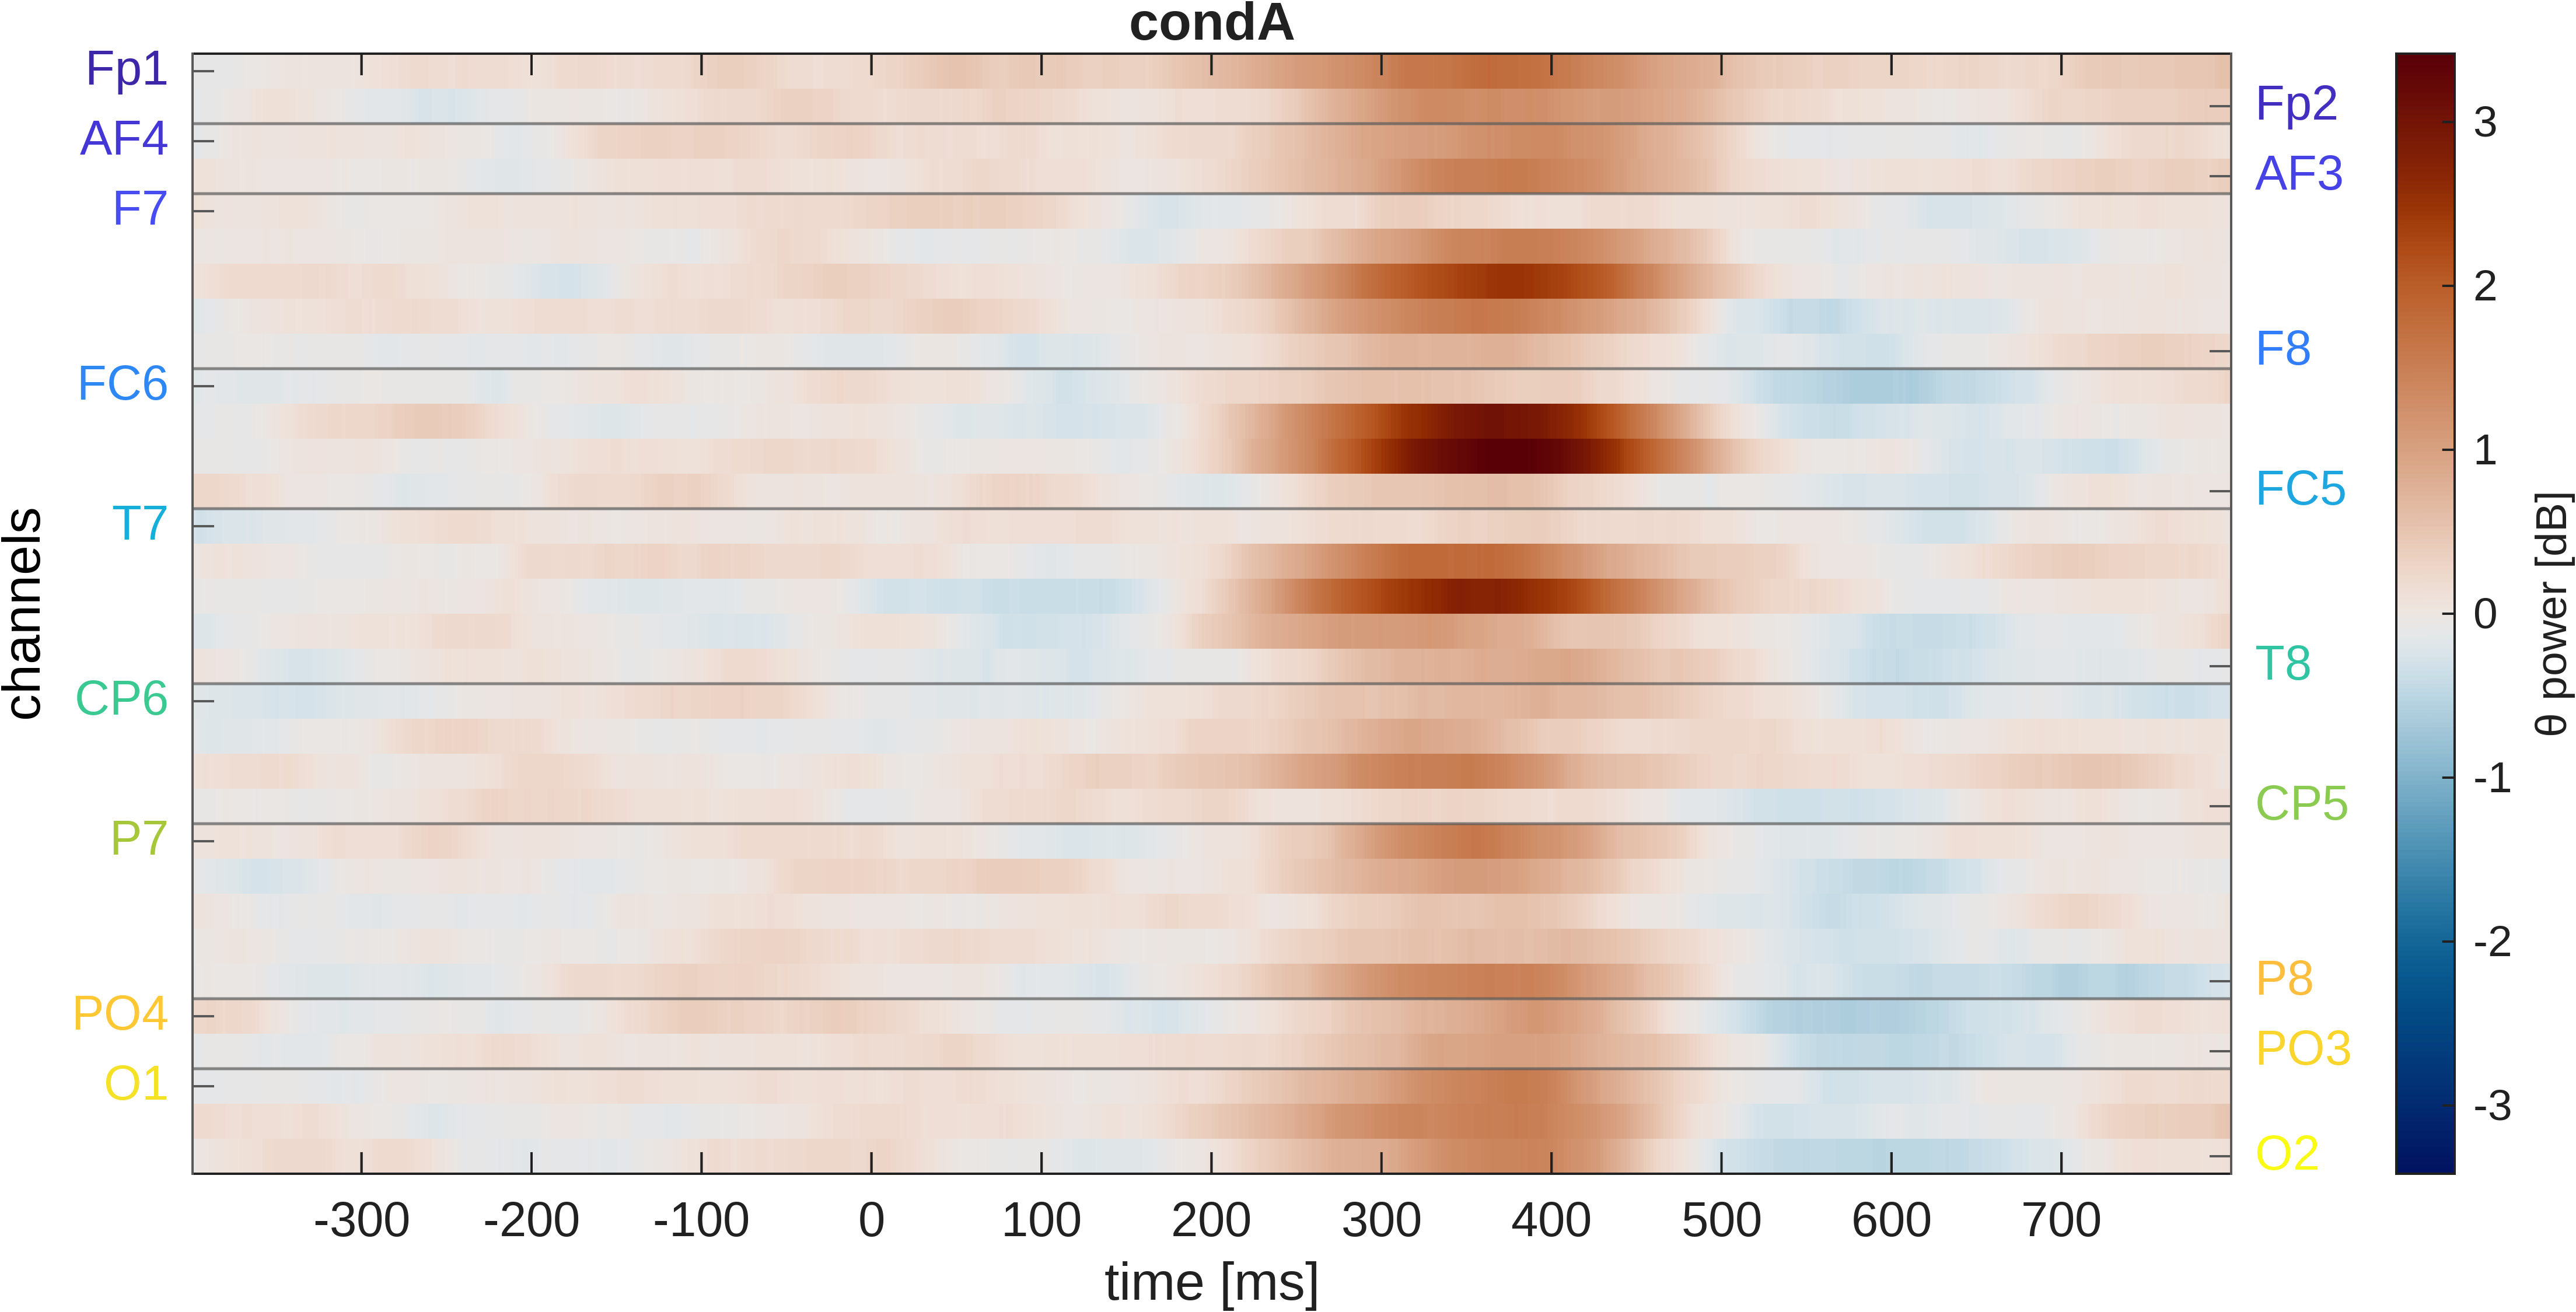
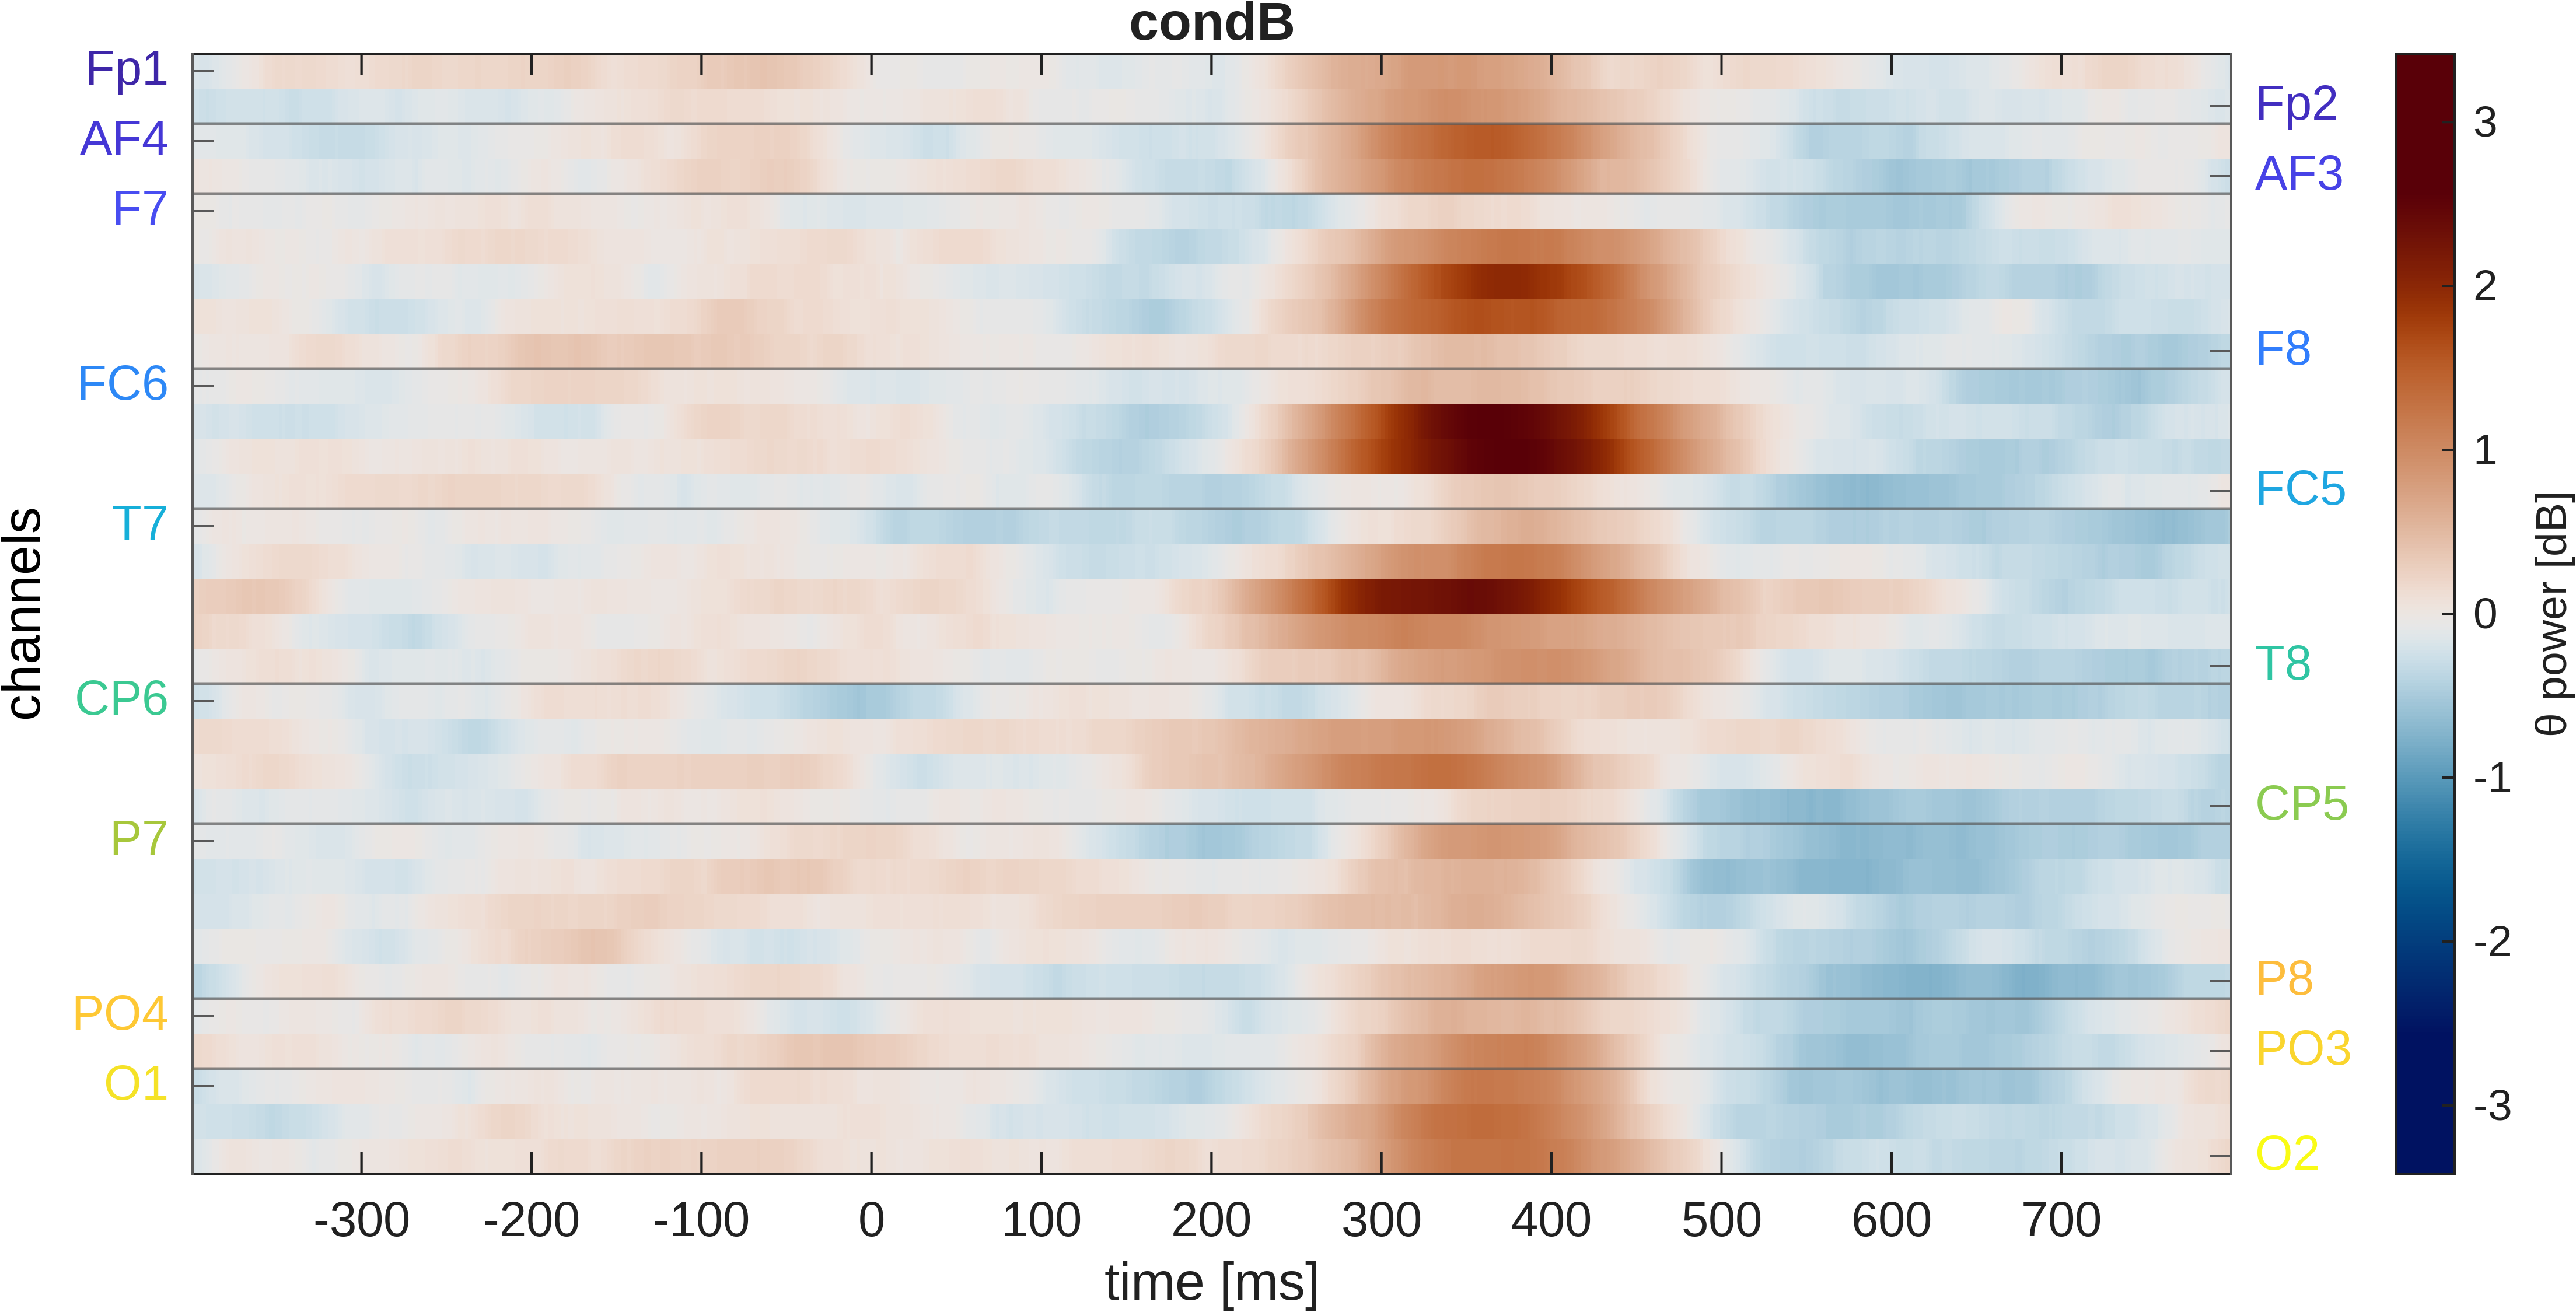
The green jelly bean problem
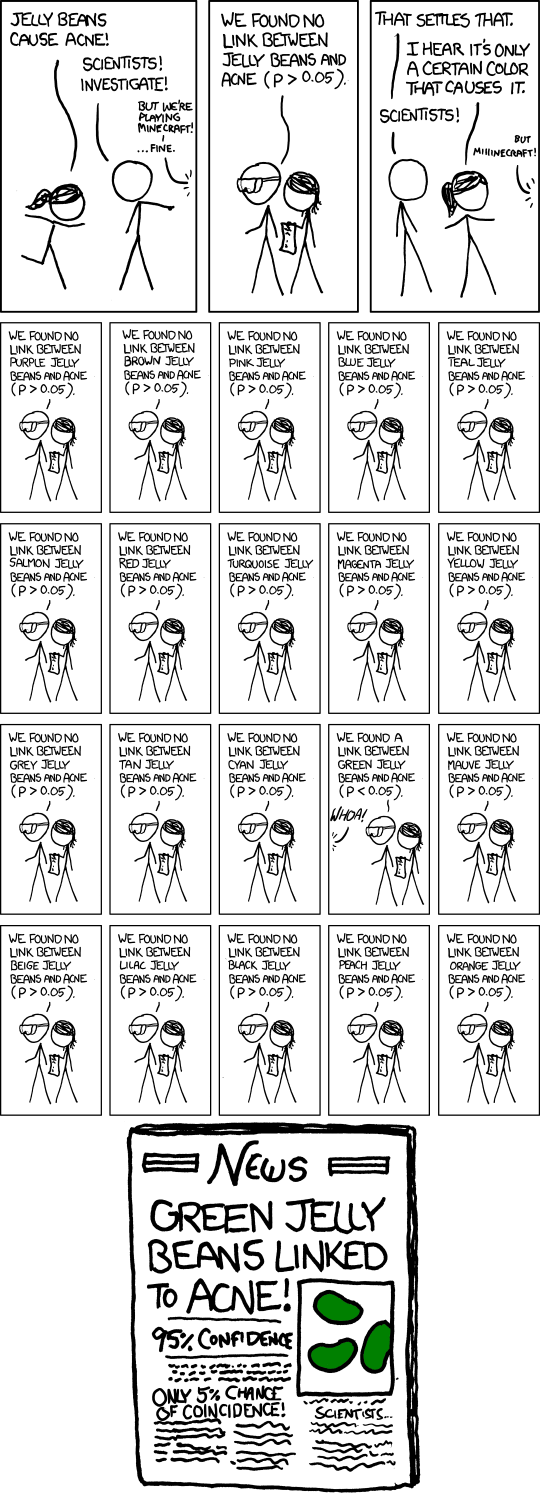
A solution: cluster-based permutation testing

foundations A foundational concepts B exchangeability under H0 A->B C parametric vs empirical H0 distribution A->C D permutation testing and Monte Carlo simulations A->D E EEG structure A->E F maxT A->F G cluster forming and metrics A->G

Exchangeability under H0

Under H0, conditions are drawn from the same distribution. There is really one distribution.


Observed data:

subj condA condB
1 A B
2 A B
3 A B
4 A B
5 A B
6 A B

If H0 is true, we can swap the labels within each participant.

iteration #1

s.
1 A B
2 B A
3 A B
4 B A
5 A B
6 B A

iteration #2

s.
1 A B
2 A B
3 B A
4 B A
5 A B
6 B A

…

iteration #N

s.
1 B A
2 B A
3 A B
4 A B
5 B A
6 A B

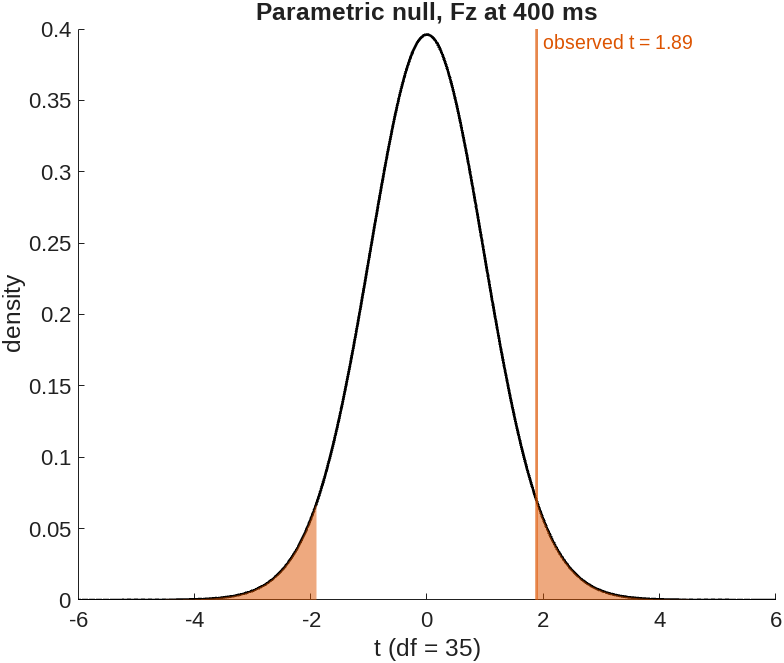
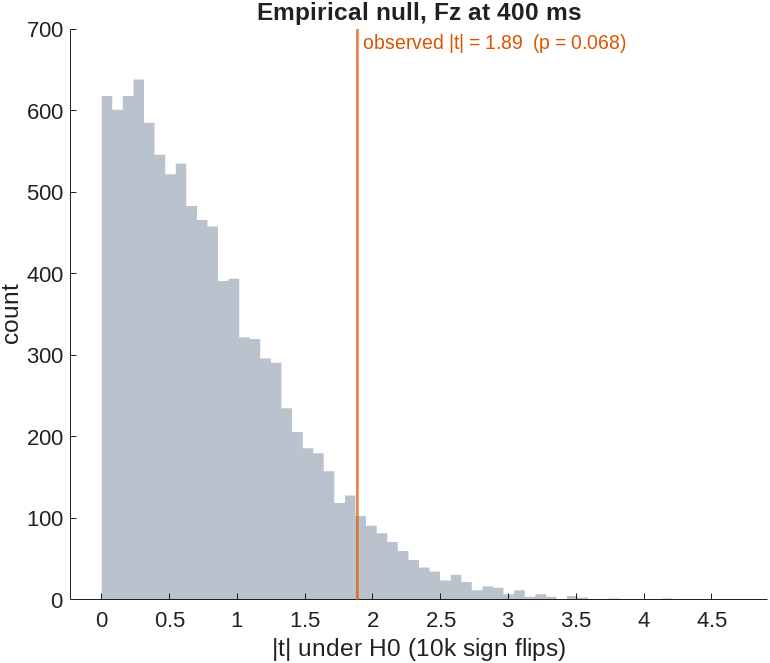
Parametric vs empirical H0 distribution

Parametric H0 distribution
Empirical H0 distribution
Permuation testing and Monte Carlo simulations

  1. compare the observed statistic against the empirical null distribution

  2. the emprical null distribution should be constructed using all possible reshuffles… or a large random sample of them (Monte Carlo)

  3. the empirical null distribution and the observed values can be constructed for any metric, not necessarily t-statistic (e.g., cluster metrics)

Data structure for a valid shuffle

  1. For a meaningful shuffle, all CondB (condA) values for a certain subject must be kept together.

  2. Careful when using for loops.

data(subj, time, chan, cond)

  1. Easier when data are structure as matrix

data (subj x cond, EEG features)


For example, time and channels must be kept together.

subj cond c1_t1 c1_t2 c1_t3 c2_t1 c2_t2 c2_t3
1 A . . . . . .
1 B . . . . . .
2 A . . . . . .
2 B . . . . . .
3 A . . . . . .
3 B . . . . . .

Swap enrire rows

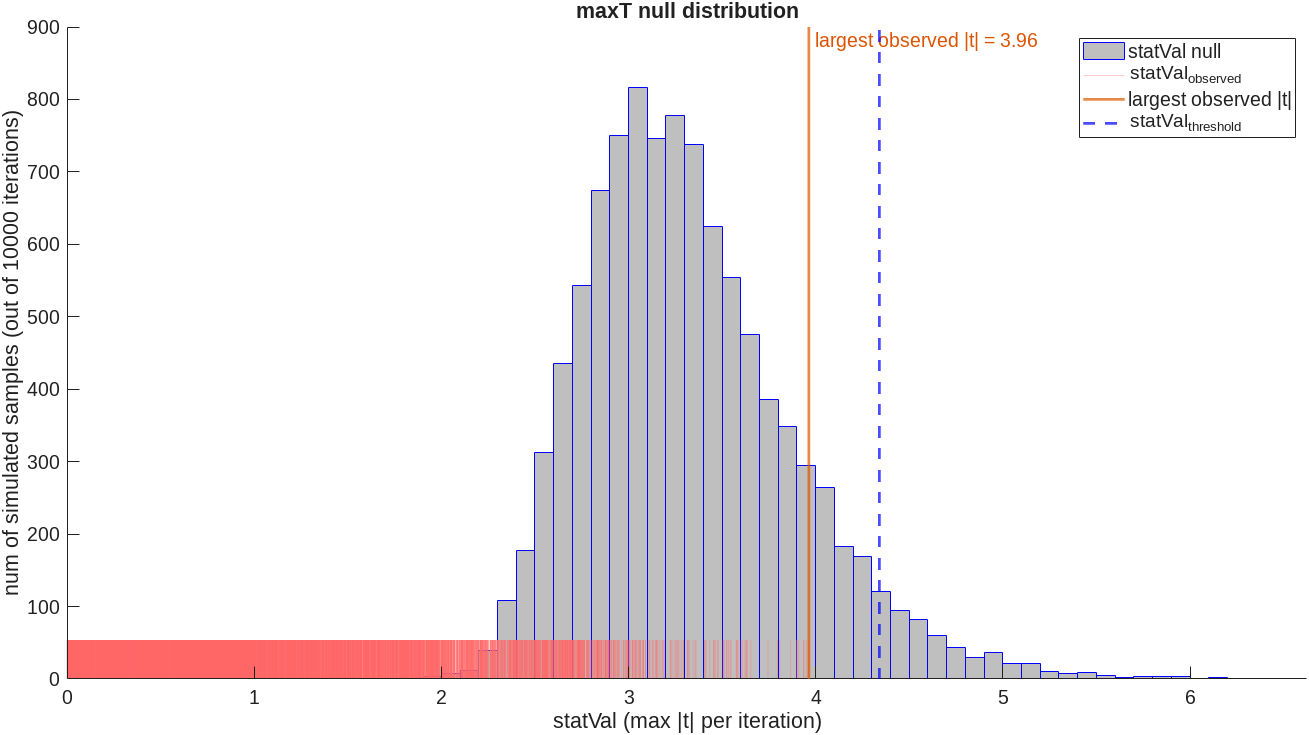
maxT

A solution to the jelly bean problem

  • For each iteration, you get a t-map across all features.

  • For each iteration, retain the maximum |t| across all features.

  • Across all iterations, build a distribution of maxT values

  • What survives is more extreme than the most extreme values obtained by chance (i.e., under the H0 of exchangeability) across all EEG dimensions
cluster forming and metrics

Effects tend to extend across neighbouring features (e.g., volume conduction, temporal autocorrelation, spectral smoothing).

Cluster forming

  1. threshold the uncorrected t-map (e.g., those corresponding to p < 0.05, uncorrected). The forming threshold is a parametric criterion (|t| ≥ 2.03, df = 35) used only to draw boundaries; the inference rests on the empirical null of the cluster metric.

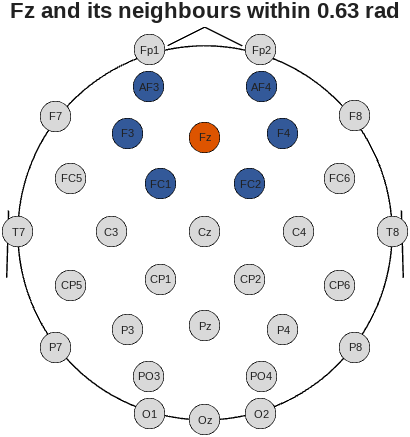
  2. define adjacency (e.g., neighbouring time points, channels within a certain distance)

  3. separately for positive and negative t-values

  4. clusters = set of suprathreshold, adjacent, same-sign t-values
Cluster metrics

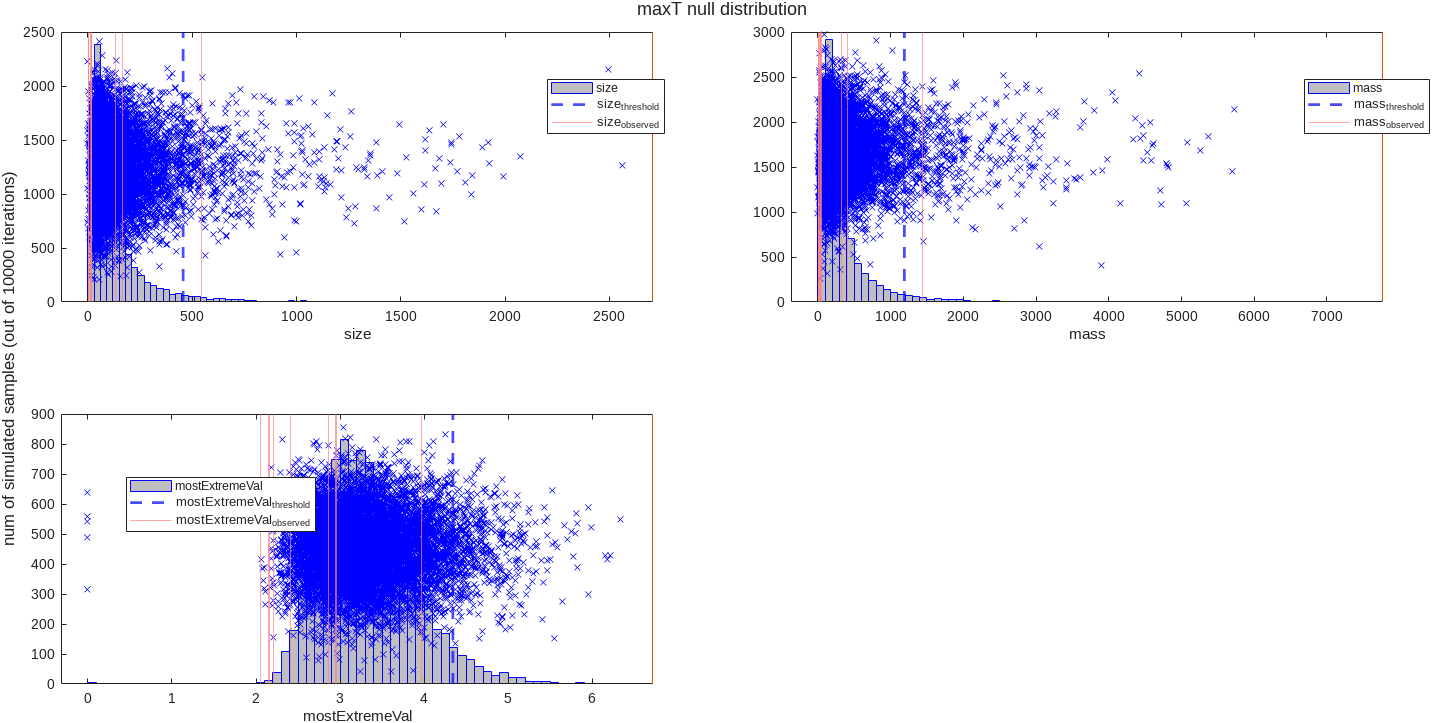
  • cluster extent/size/numerosity = number of features in the cluster

  • cluster height/most extreme value = most extreme t-value in the cluster

  • cluster mass = sum of t-values in the cluster

  • cluster mass (robust) = median of t-values in the cluster times the number of features in the cluster

Remember, the H0 distribution can be built with any metric. For example, cluster metrics.

Cluster-based permutation testing, with maxT correction

clusterLoop S shuffle rows according to the design T t-map across all features S->T C form clusters T->C M cluster metrics C->M X retain the largest metric M->X X->S repeat × 10,000 H empirical H0 distribution of max cluster metrics X->H
Cluster-based permutation testing, with maxT correction

On observed data:

  1. compute t-map across all features
  2. form clusters and compute cluster metrics

On each Monte Carlo iteration:

  1. shuffle the data according to the design
  2. compute t-map across all features
  3. form clusters and compute cluster metrics
  4. only retain the largest cluster metric (maxT)
  5. build the empirical H0 distribution of max cluster metrics

Test the observed cluster metrics against the empirical H0 distribution of max cluster metrics

Proportion of null maxima at or beyond an observed cluster metric = p-value for that cluster

Caveats

  1. Cluster-based permutation testing did not test the location or the boundaries of the cluster. It tested the existence of a cluster of a certain mass.

  2. Cluster forming depends on the threshold chosen (e.g., p < 0.05, uncorrected). Different thresholds can yield different clusters.

  3. Not well behaved where the same effect has different signs across the dimensions (e.g., N170 and VPP)


Diagonale: what it is

A MATLAB toolbox for permutation-based inference on EEG data.

Three inputs:

input content
Y observations × features (e.g., participant × condition rows; channel × time columns)
X design: contrasts, group codes, or continuous predictors
dataStruct what each row of Y is (participant, condition, group, …)

Scripting, not programming: the user sets configuration fields; the toolbox validates every field before anything runs.

Diagonale: one engine, three levels of inference

levels E rearrangement engine (permutation for H0 testing, bootstrap for stability) F feature level max |t| E->F C cluster level max cluster metric E->C L latent level singular value E->L

Diagonale: where to find it