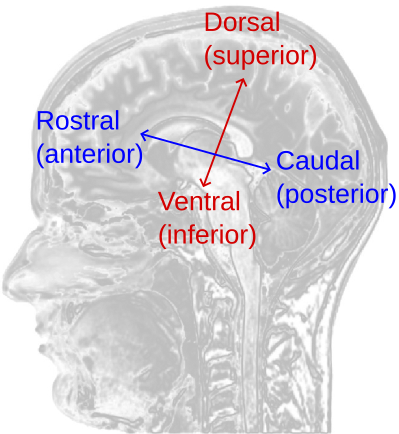
Anatomical directions
- Anterior (or rostral): towards the front (towards the face)
- Posterior (or caudal): towards the back (towards the tail)
- Superior (or dorsal): upwards
- Inferior (or ventral): downwards
- Lateral: towards the side
- Medial: towards the midline
- Ipsilateral: same side
- Contralateral: opposite side
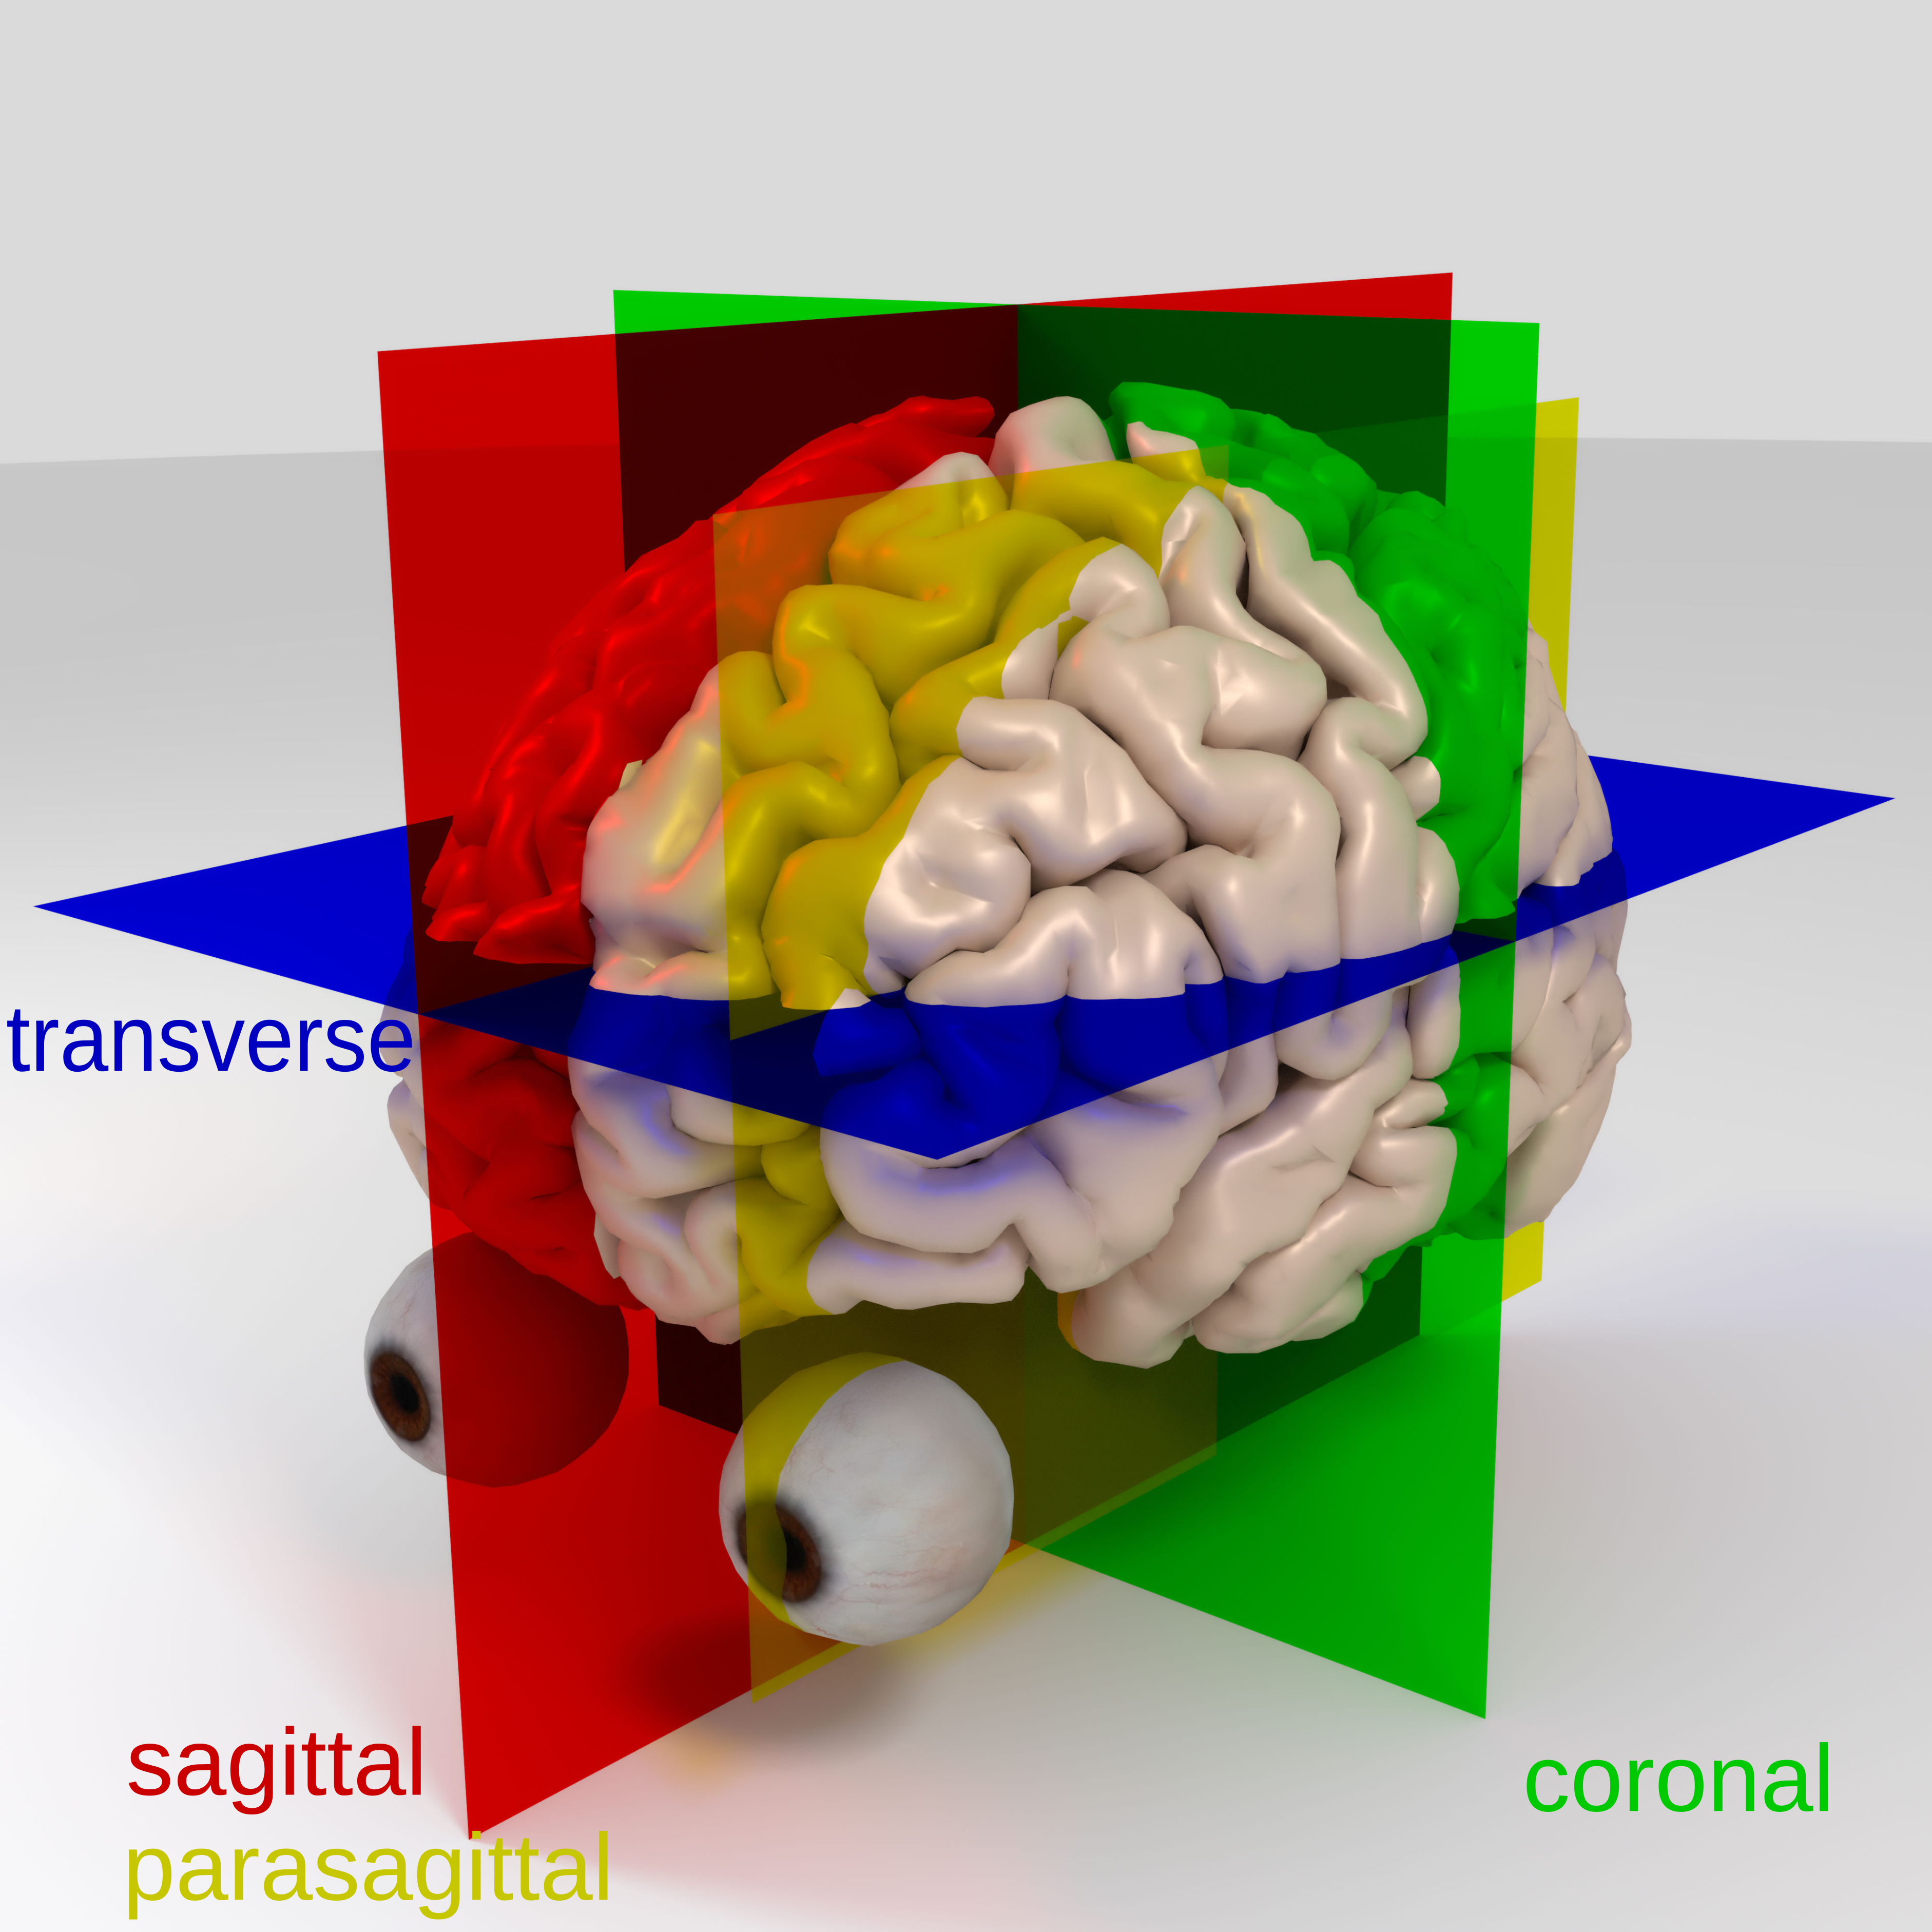
Anatomical planes
Anatomical planes (useful to imagine as slices):
- Sagittal (midsagittal): vertical plane through the midline, dividing brain into left and right hemispheres
- Parasagittal: vertical plane parallel to the midline, dividing left and right but off-center
- Coronal (or frontal): vertical plane perpendicular to the midline, dividing anterior (rostral) and posterior (caudal)
- Transverse (or horizontal): horizontal plane dividing superior (dorsal) and inferior (ventral)
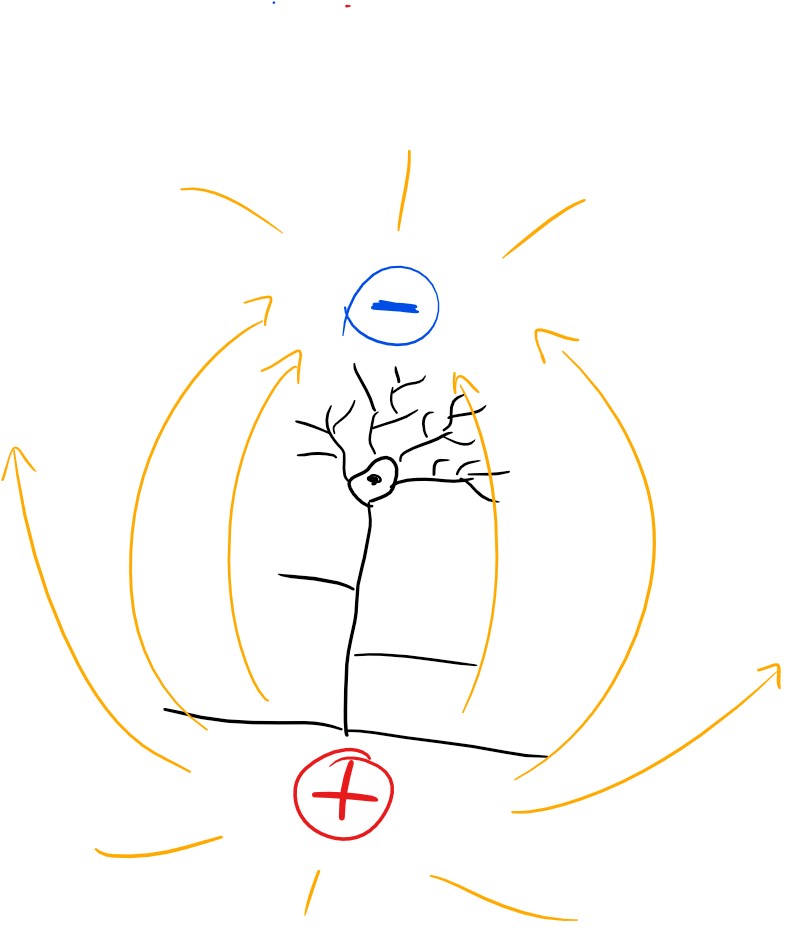
Dipoles in the brain
- Electrochemical activity in the dendrites generates electric fields.
- These fields create dipoles due to the separation of charges.
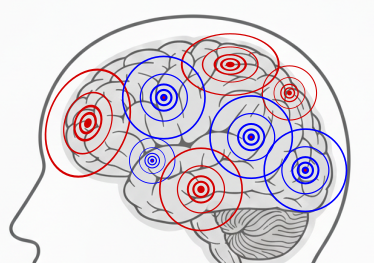
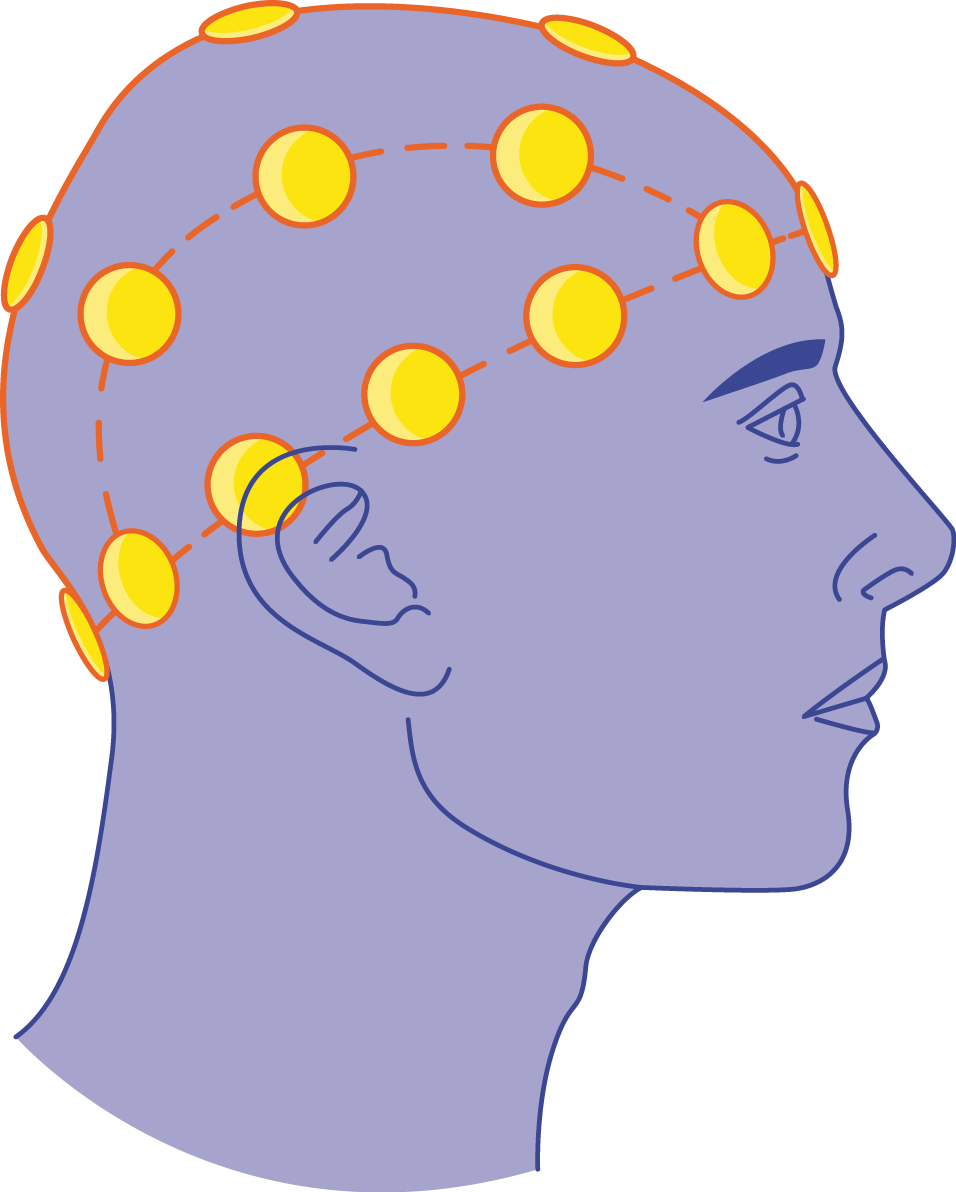
Detecting dipoles from the scalp
Electric fields propagate through the tissues (volume conduction), allowing us to detect the activity of neuronal populations from electrodes placed on the scalp.
Several dipoles can be detected simultaneously.
We can observe scalp activity but it is challenging to determine the exact location of the underlying dipoles (so called, inverse problem).
Types of dipoles detectable from the scalp
- Radial dipoles: Oriented perpendicular to the cortical surface, often generated by pyramidal neurons in the gyri. These dipoles are more likely to be detected from electrodes on the scalp because their orientation aligns with the electrodes on the scalp.
- Tangential dipoles: Oriented parallel to the cortical surface, often found in the walls of the sulci. These dipoles are less likely to be detected by electrodes on the scalp as their orientation does not align well with the scalp.
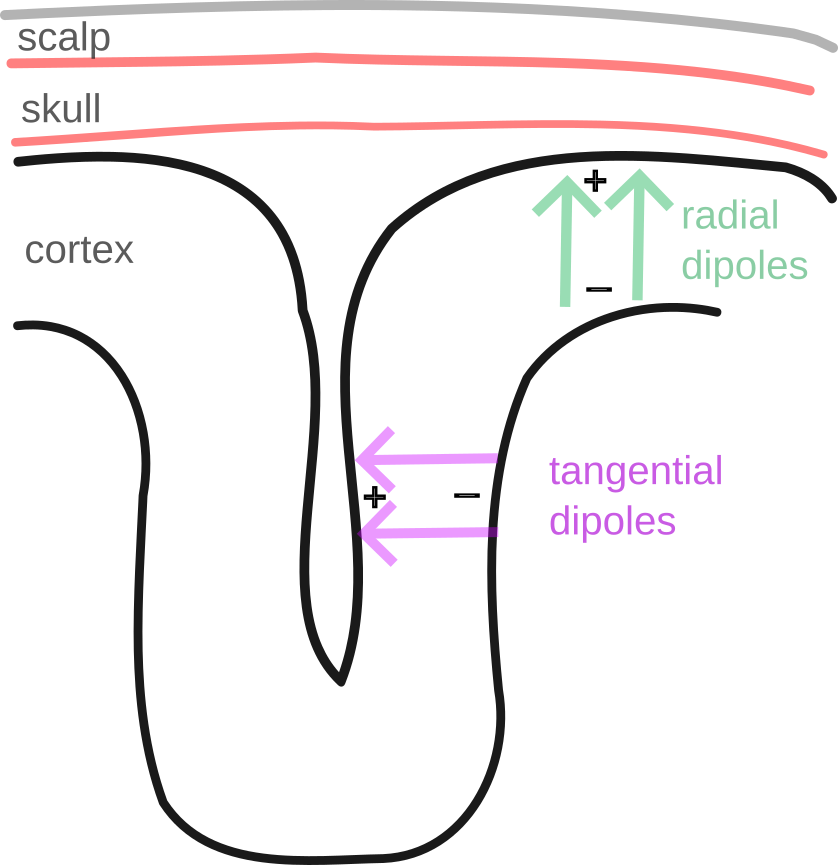
- Both types of dipoles contribute to the overall EEG signal, but radial dipoles generally have a stronger influence due to their alignment with the scalp surface.
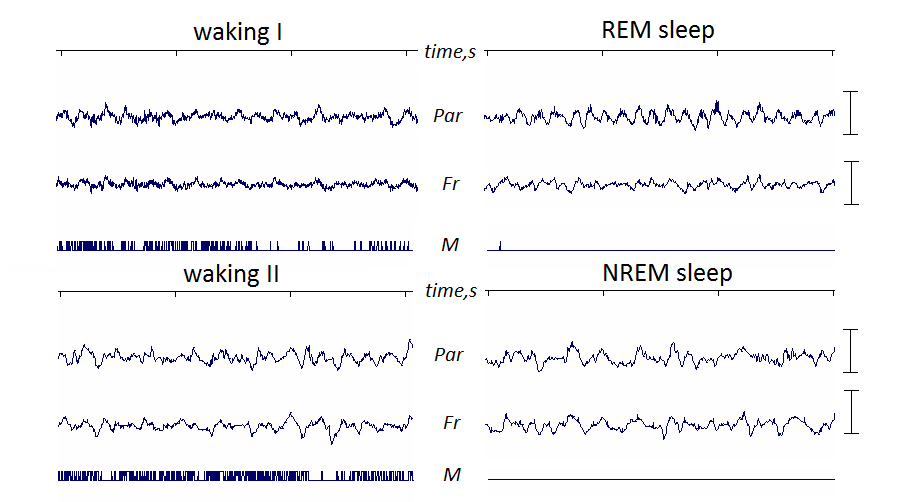
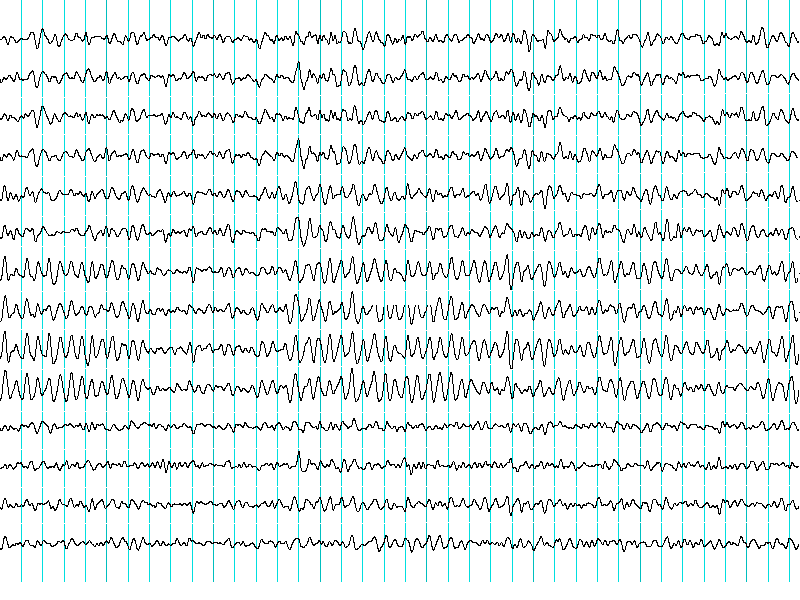
EEG signal morphology
EEG signals appear like complex waveforms, consisting of multiple overlapping waveforms that vary in frequency, phase, and amplitude.

The three main parameters of waveforms
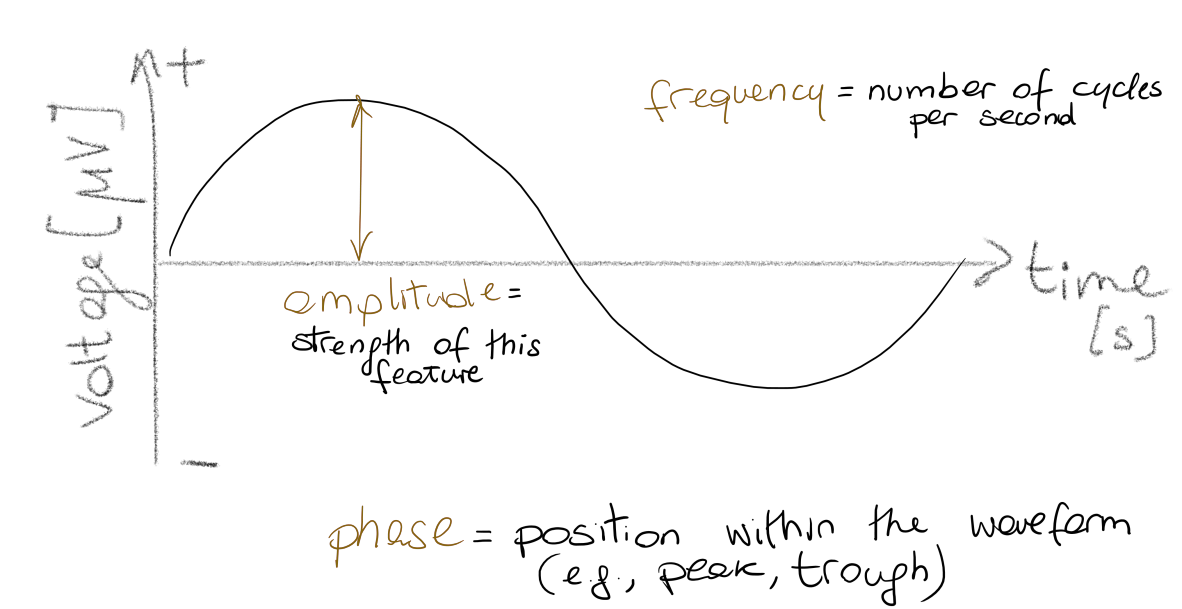
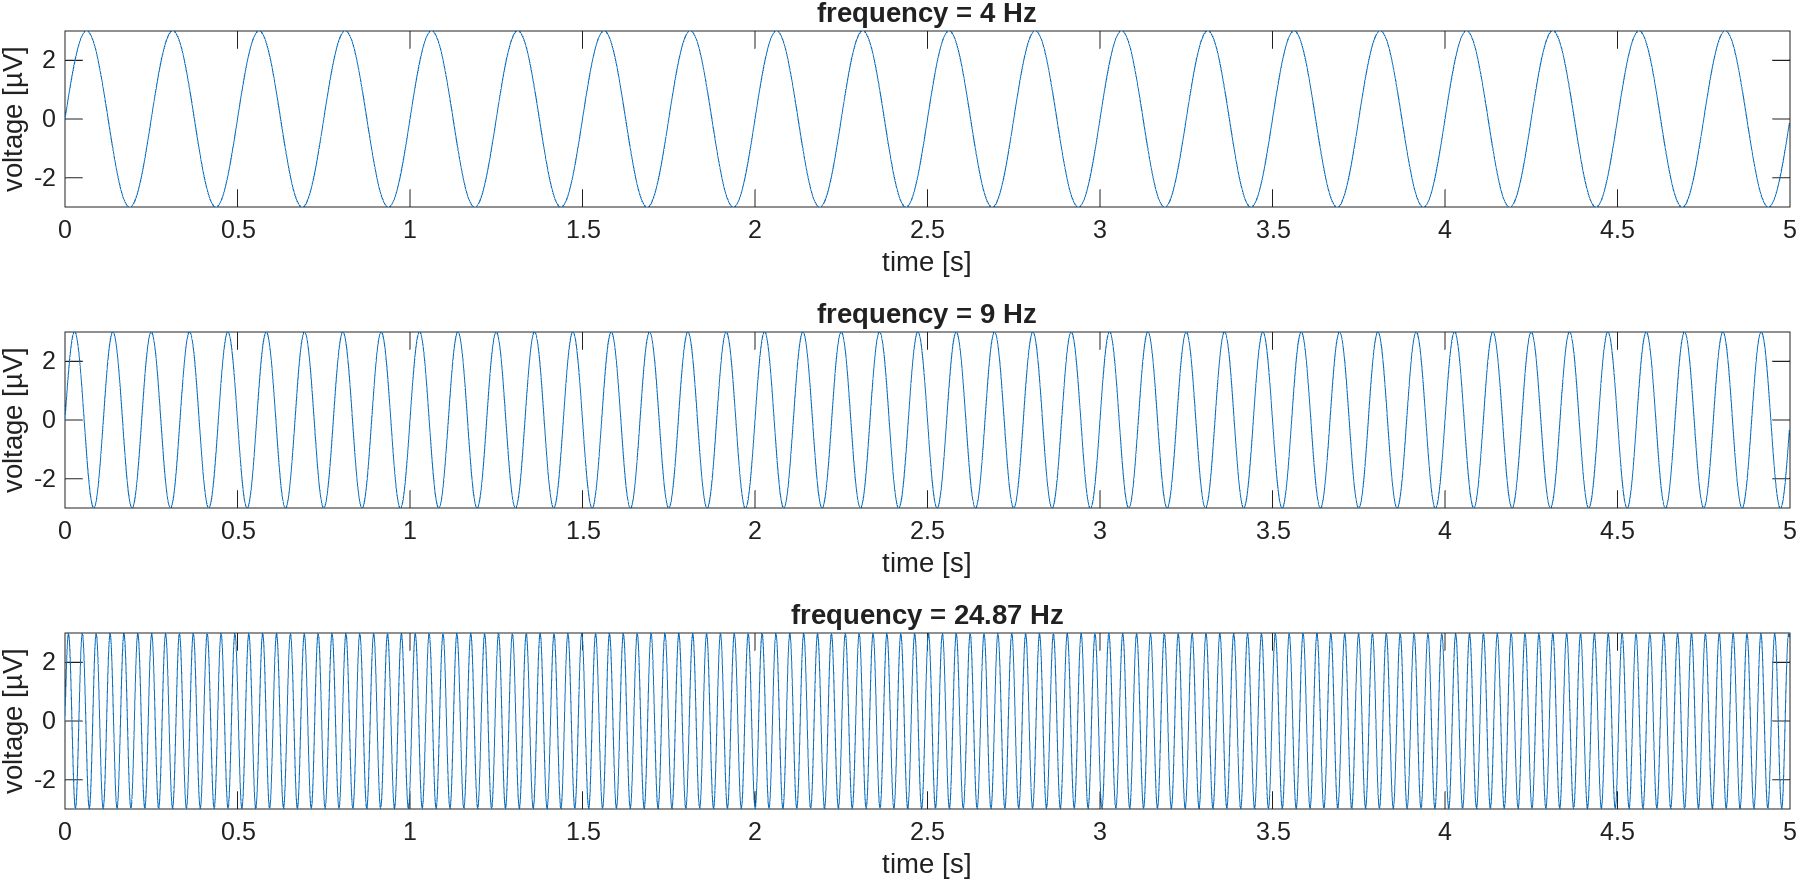
- Frequency: The number of cycles the waveform completes in a given time period, usually measured in Hertz (Hz). Higher frequency indicates more cycles per second.
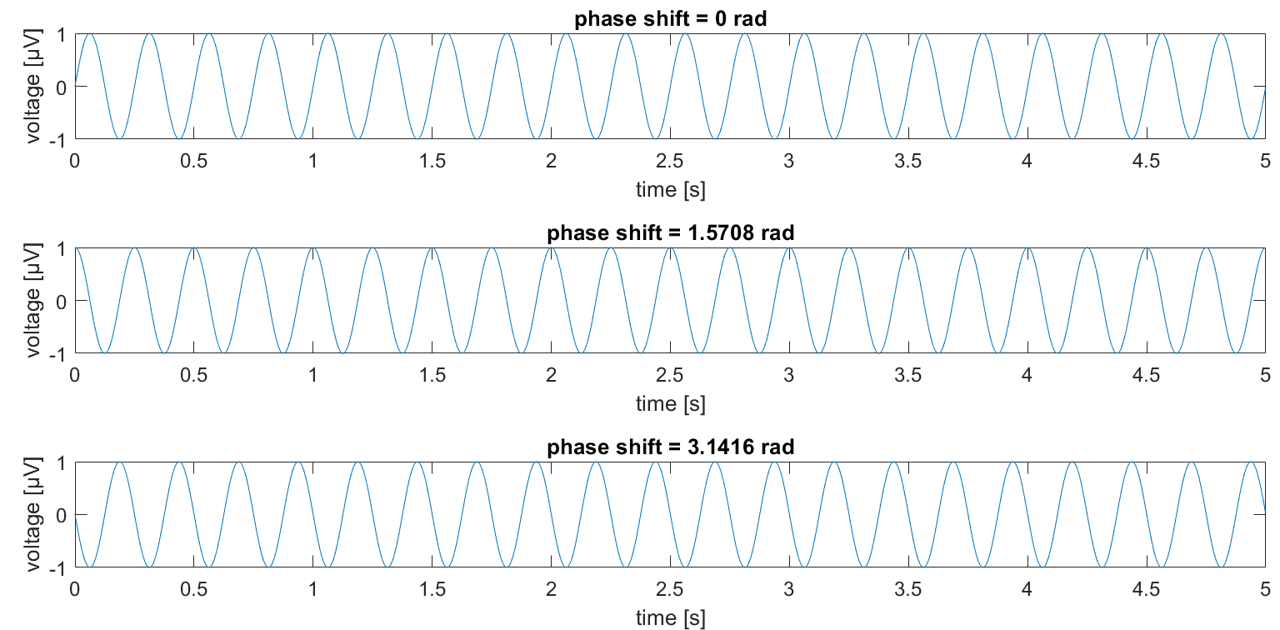
- Phase: The position of a point in time on the waveform cycle, indicating the timing of the waveform relative to a reference point. Phase differences can affect how waveforms interact with each other.
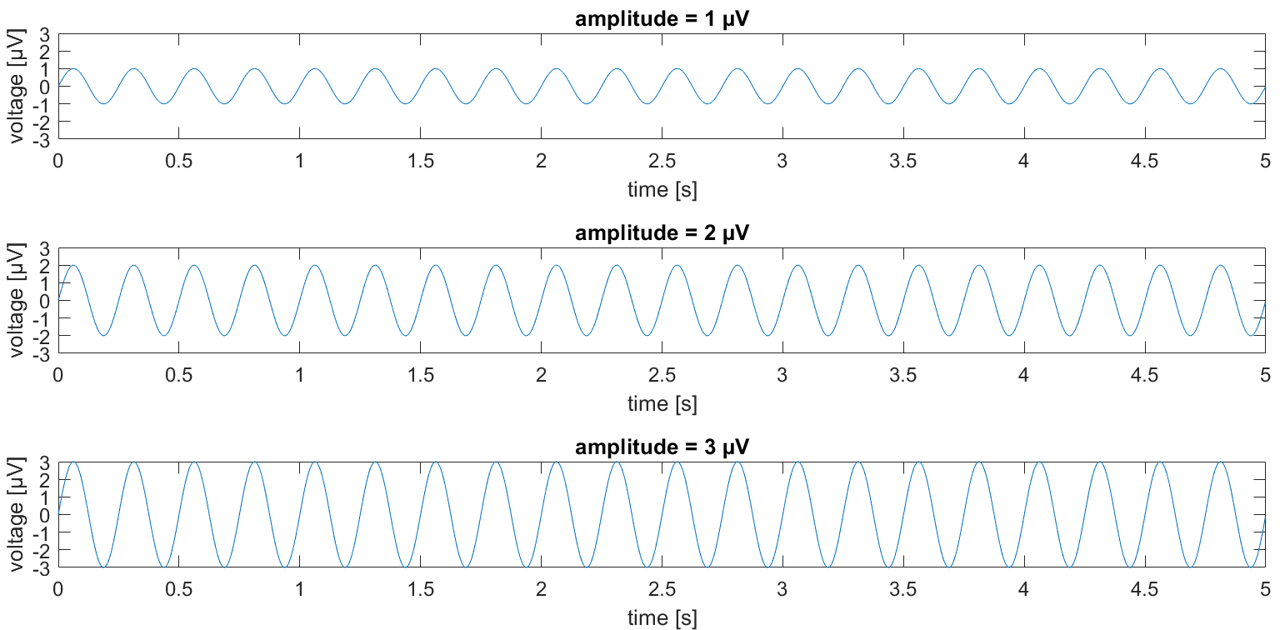
- Amplitude: The height of the waveform, representing the strength or intensity of the signal. Higher amplitude indicates stronger signals.
Manipulating one parameter at a time
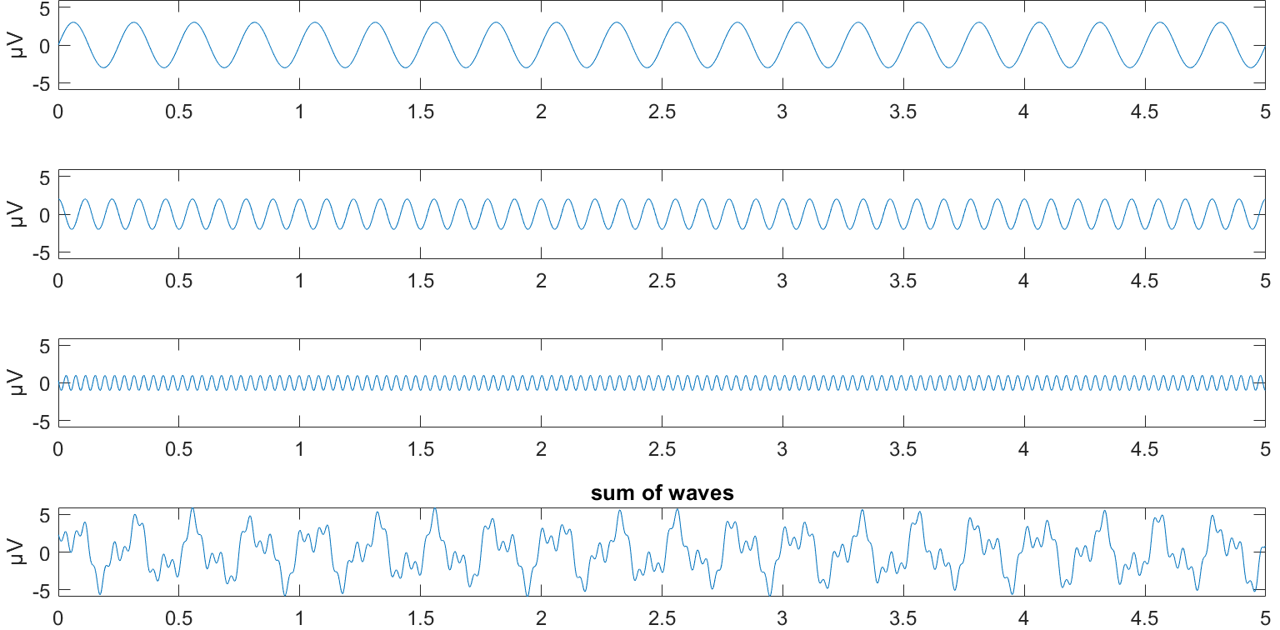
Simulating EEG signal
Let’s sum, time by time, three waves varying in frequency, phase, and amplitude.
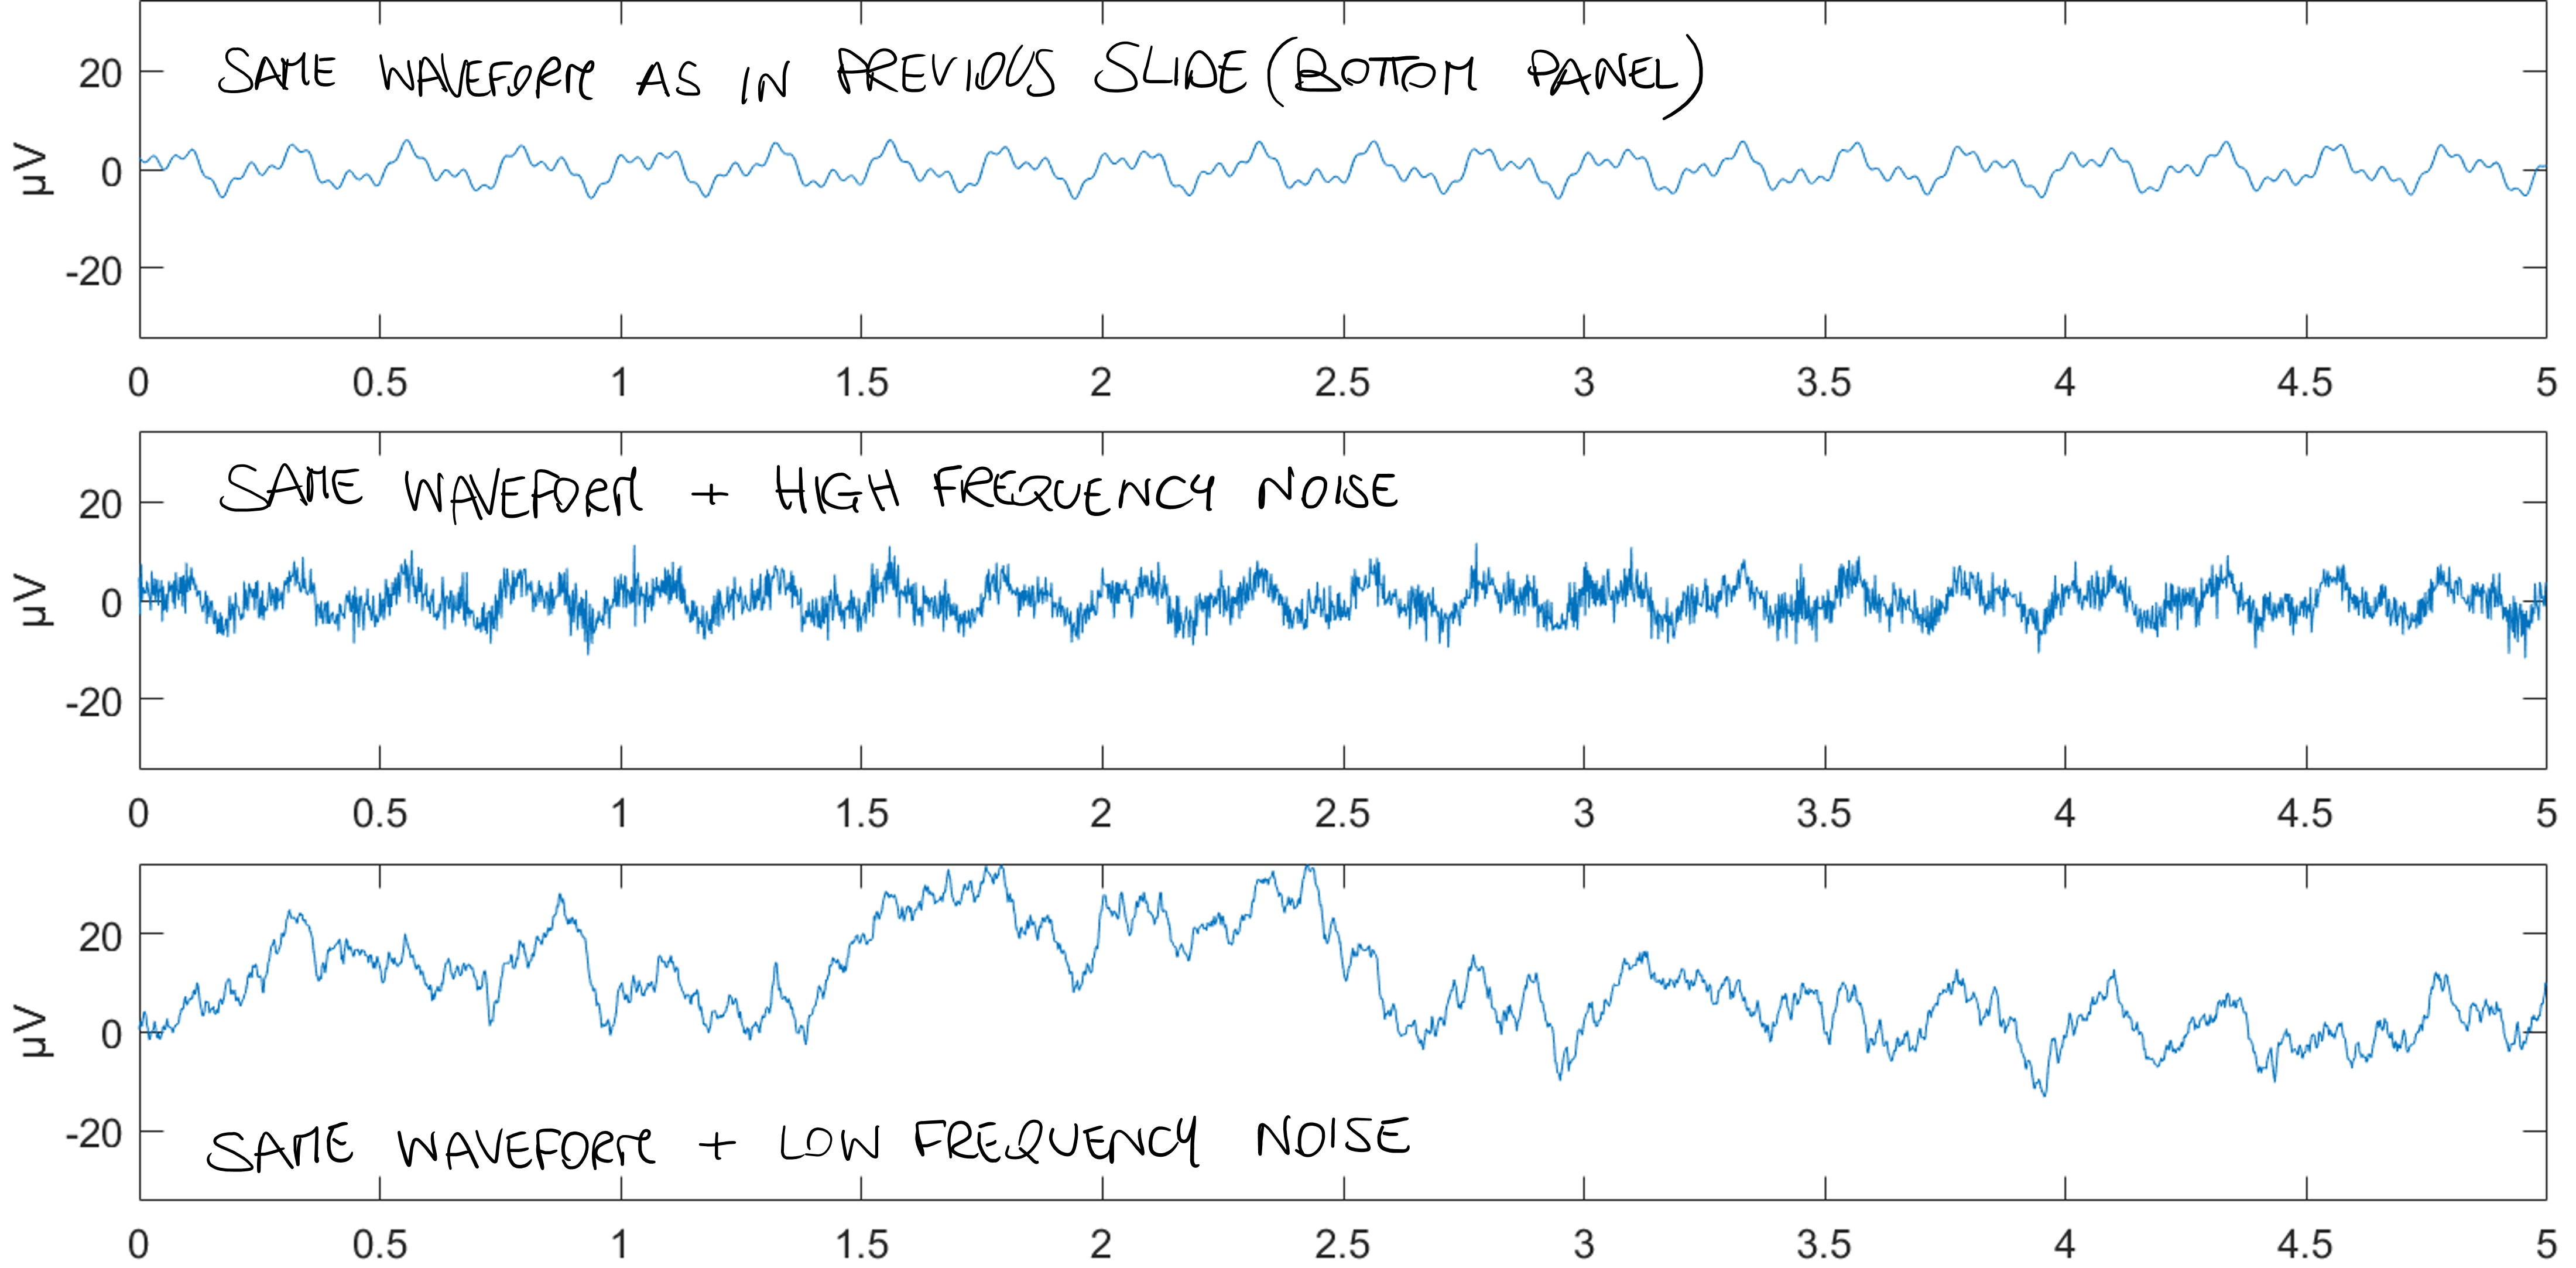
Simulating EEG signal with noise
Same as before but adding noise.
10-20 system: main ideas
An internationally recognized method to describe the location of scalp electrodes.
- Electrodes are placed at intervals of 10% or 20% of the total distance between specified skull landmarks.
- Landmarks include the nasion (bridge of the nose), inion (bump at the back of the skull), and preauricular points (just in front of the ears).
10-20 system examples
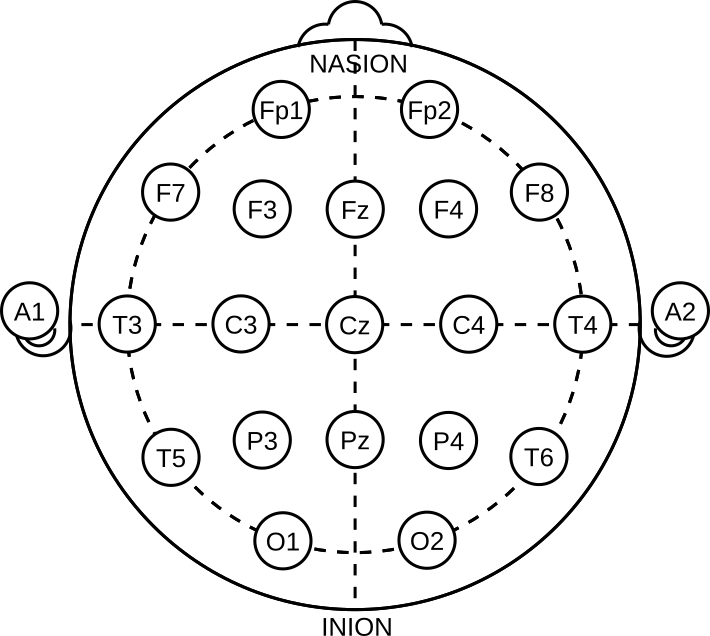
Some examples:
- Cz = central on the midline (aka vertex)
- P3 = parietal, lateral to the left
- P5 = parietal, even more lateral to the left (not in the figure)
EEG signals
Sources of noise in the EEG signal
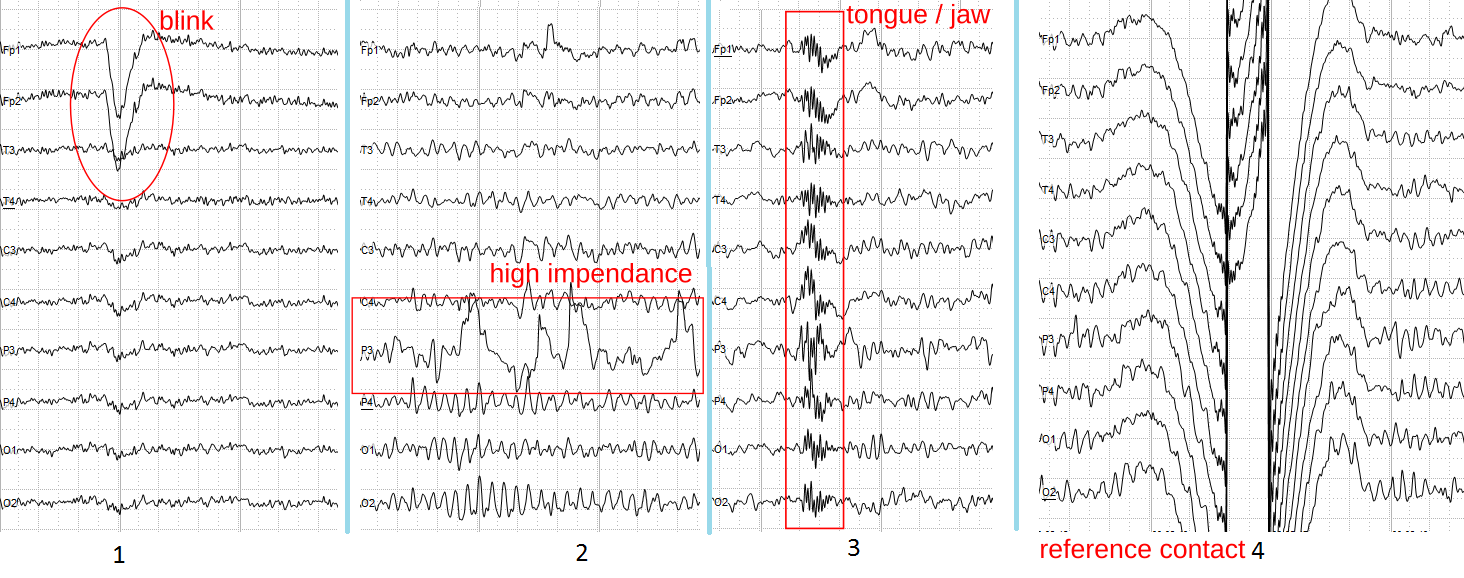
Commonly known as “artifacts”.
They are of non-neural origin and can contaminate the EEG signal and obscure the underlying brain activity.
- Eye movements: blinks and saccades, especially in the frontal region.
- Muscle activity: tension or movements in the scalp, neck, or face muscles can introduce high-frequency noise.
- Electrode movement: shifts in electrode position can cause sudden changes in the recorded signal.
- Sweat: changes in skin conductance can affect low-frequency characteristics.
- Heartbeats: electrical activity of the heart (e.g., R-waves, pulse waves).
- Environmental noise: electrical interference from nearby equipment or power lines can introduce 50/60 Hz noise.
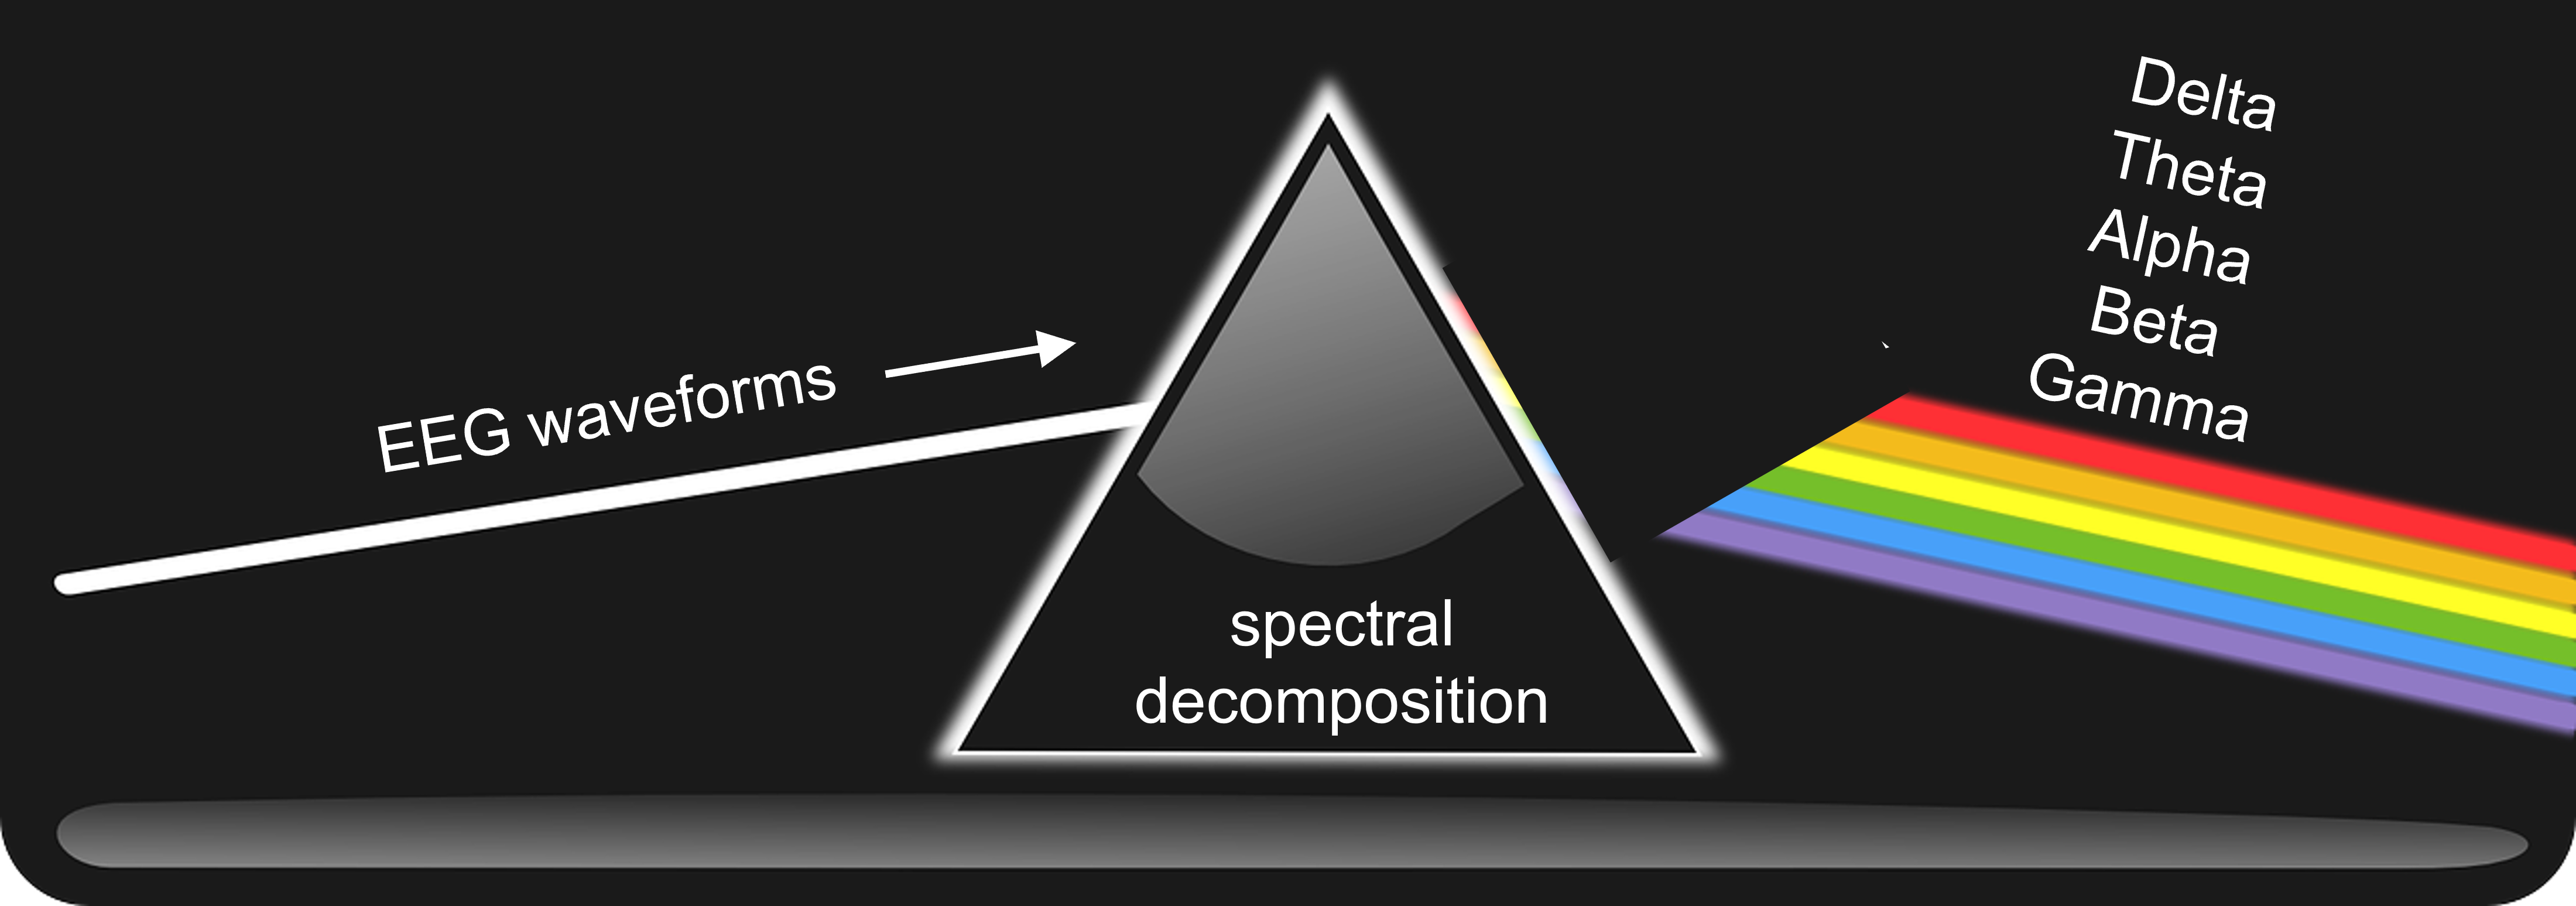
Decomposing the EEG signal into its frequency components
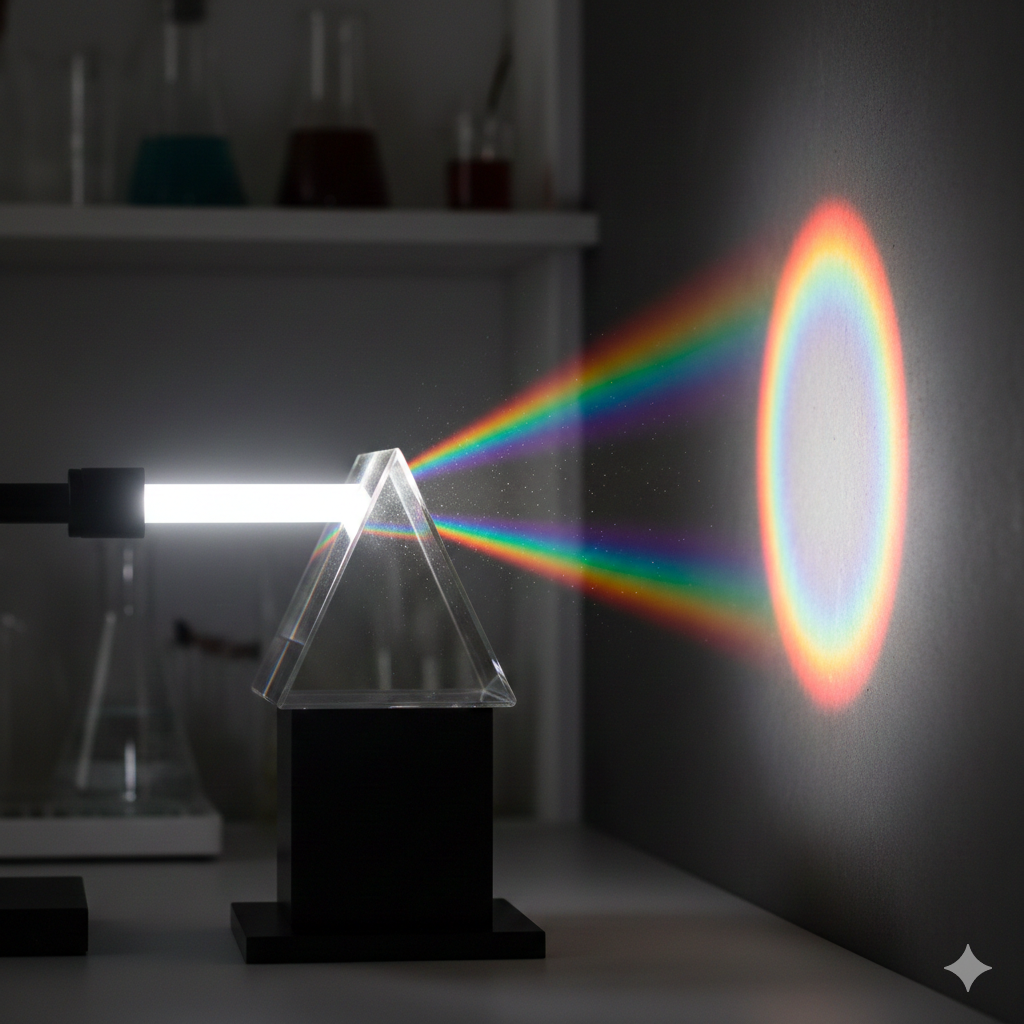
A prism can break down white light into its component colors
Similarly, spectral decomposition techniques can break down the composite EEG waveforms into their component frequencies. Sometimes referred to as “brain rhythms”.
Topographical mapping
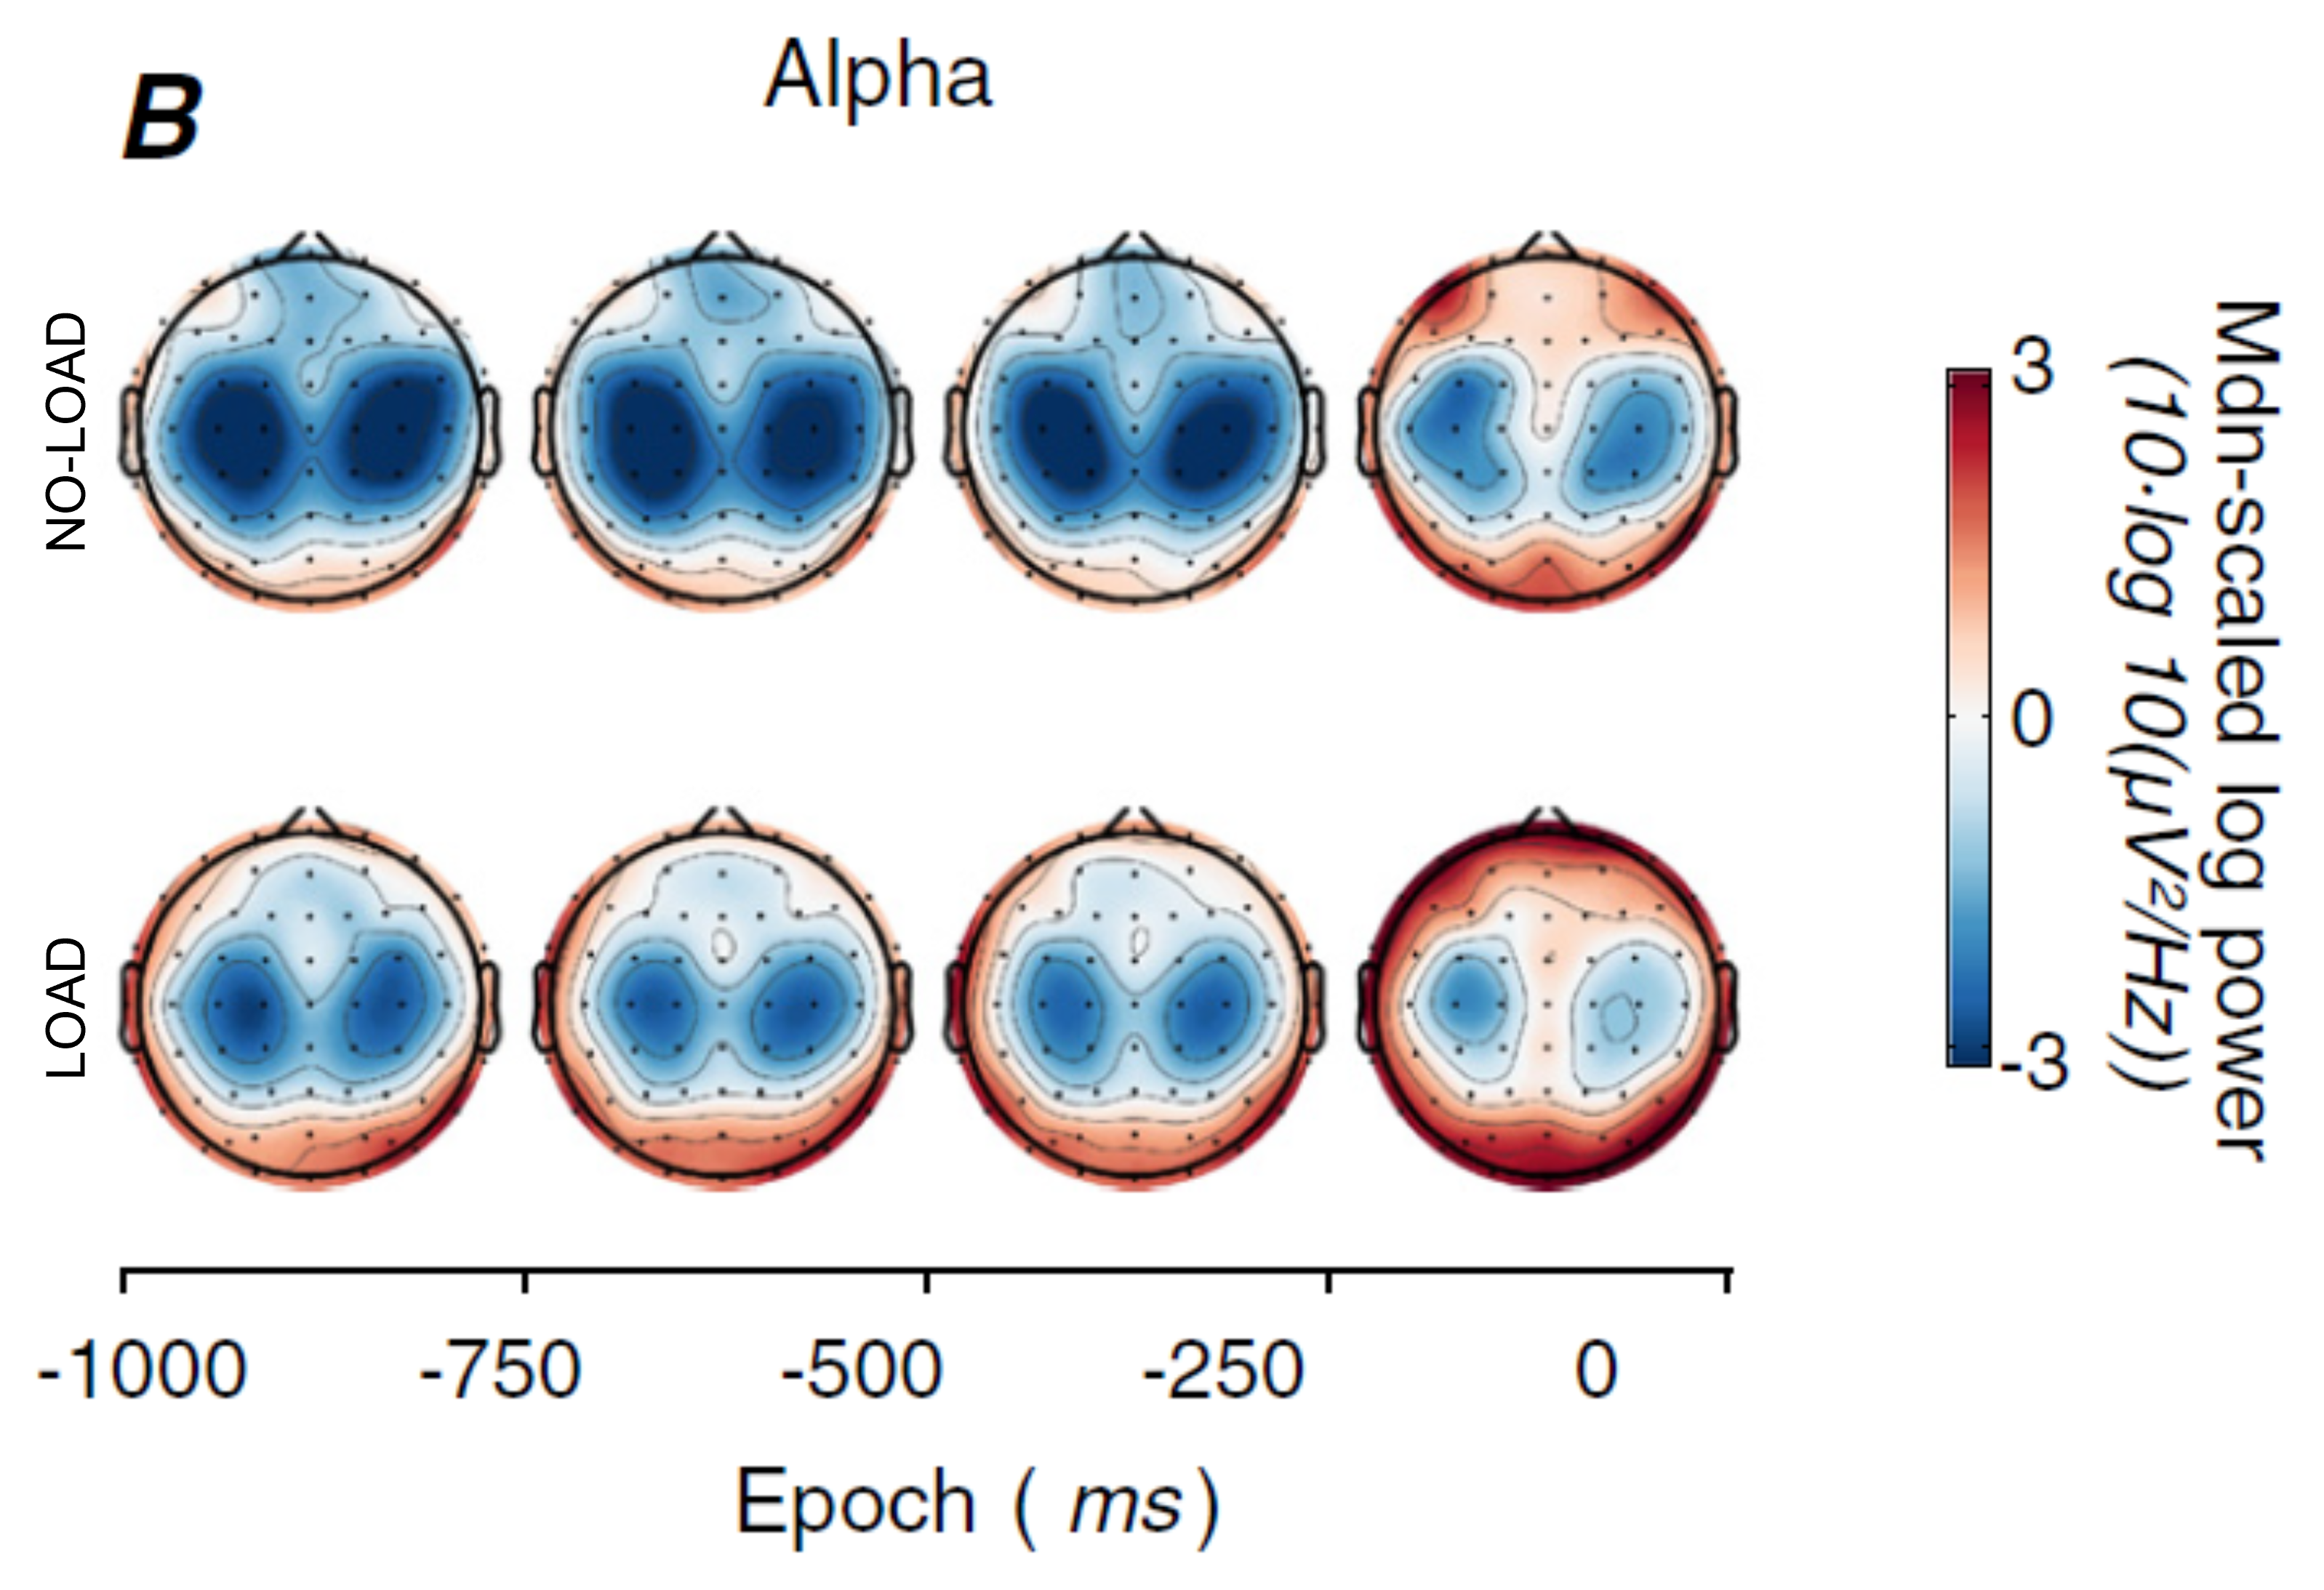
- Visual representation of EEG data across the scalp. Typically, seen from the top, with the nose pointing upwards.
- Color indicates the strength of the metric of interest (e.g., power in a specific frequency band, amplitude of an ERP component). Important: a scalp map should always be given with a colour bar
- Helps identify spatial patterns of brain activity.
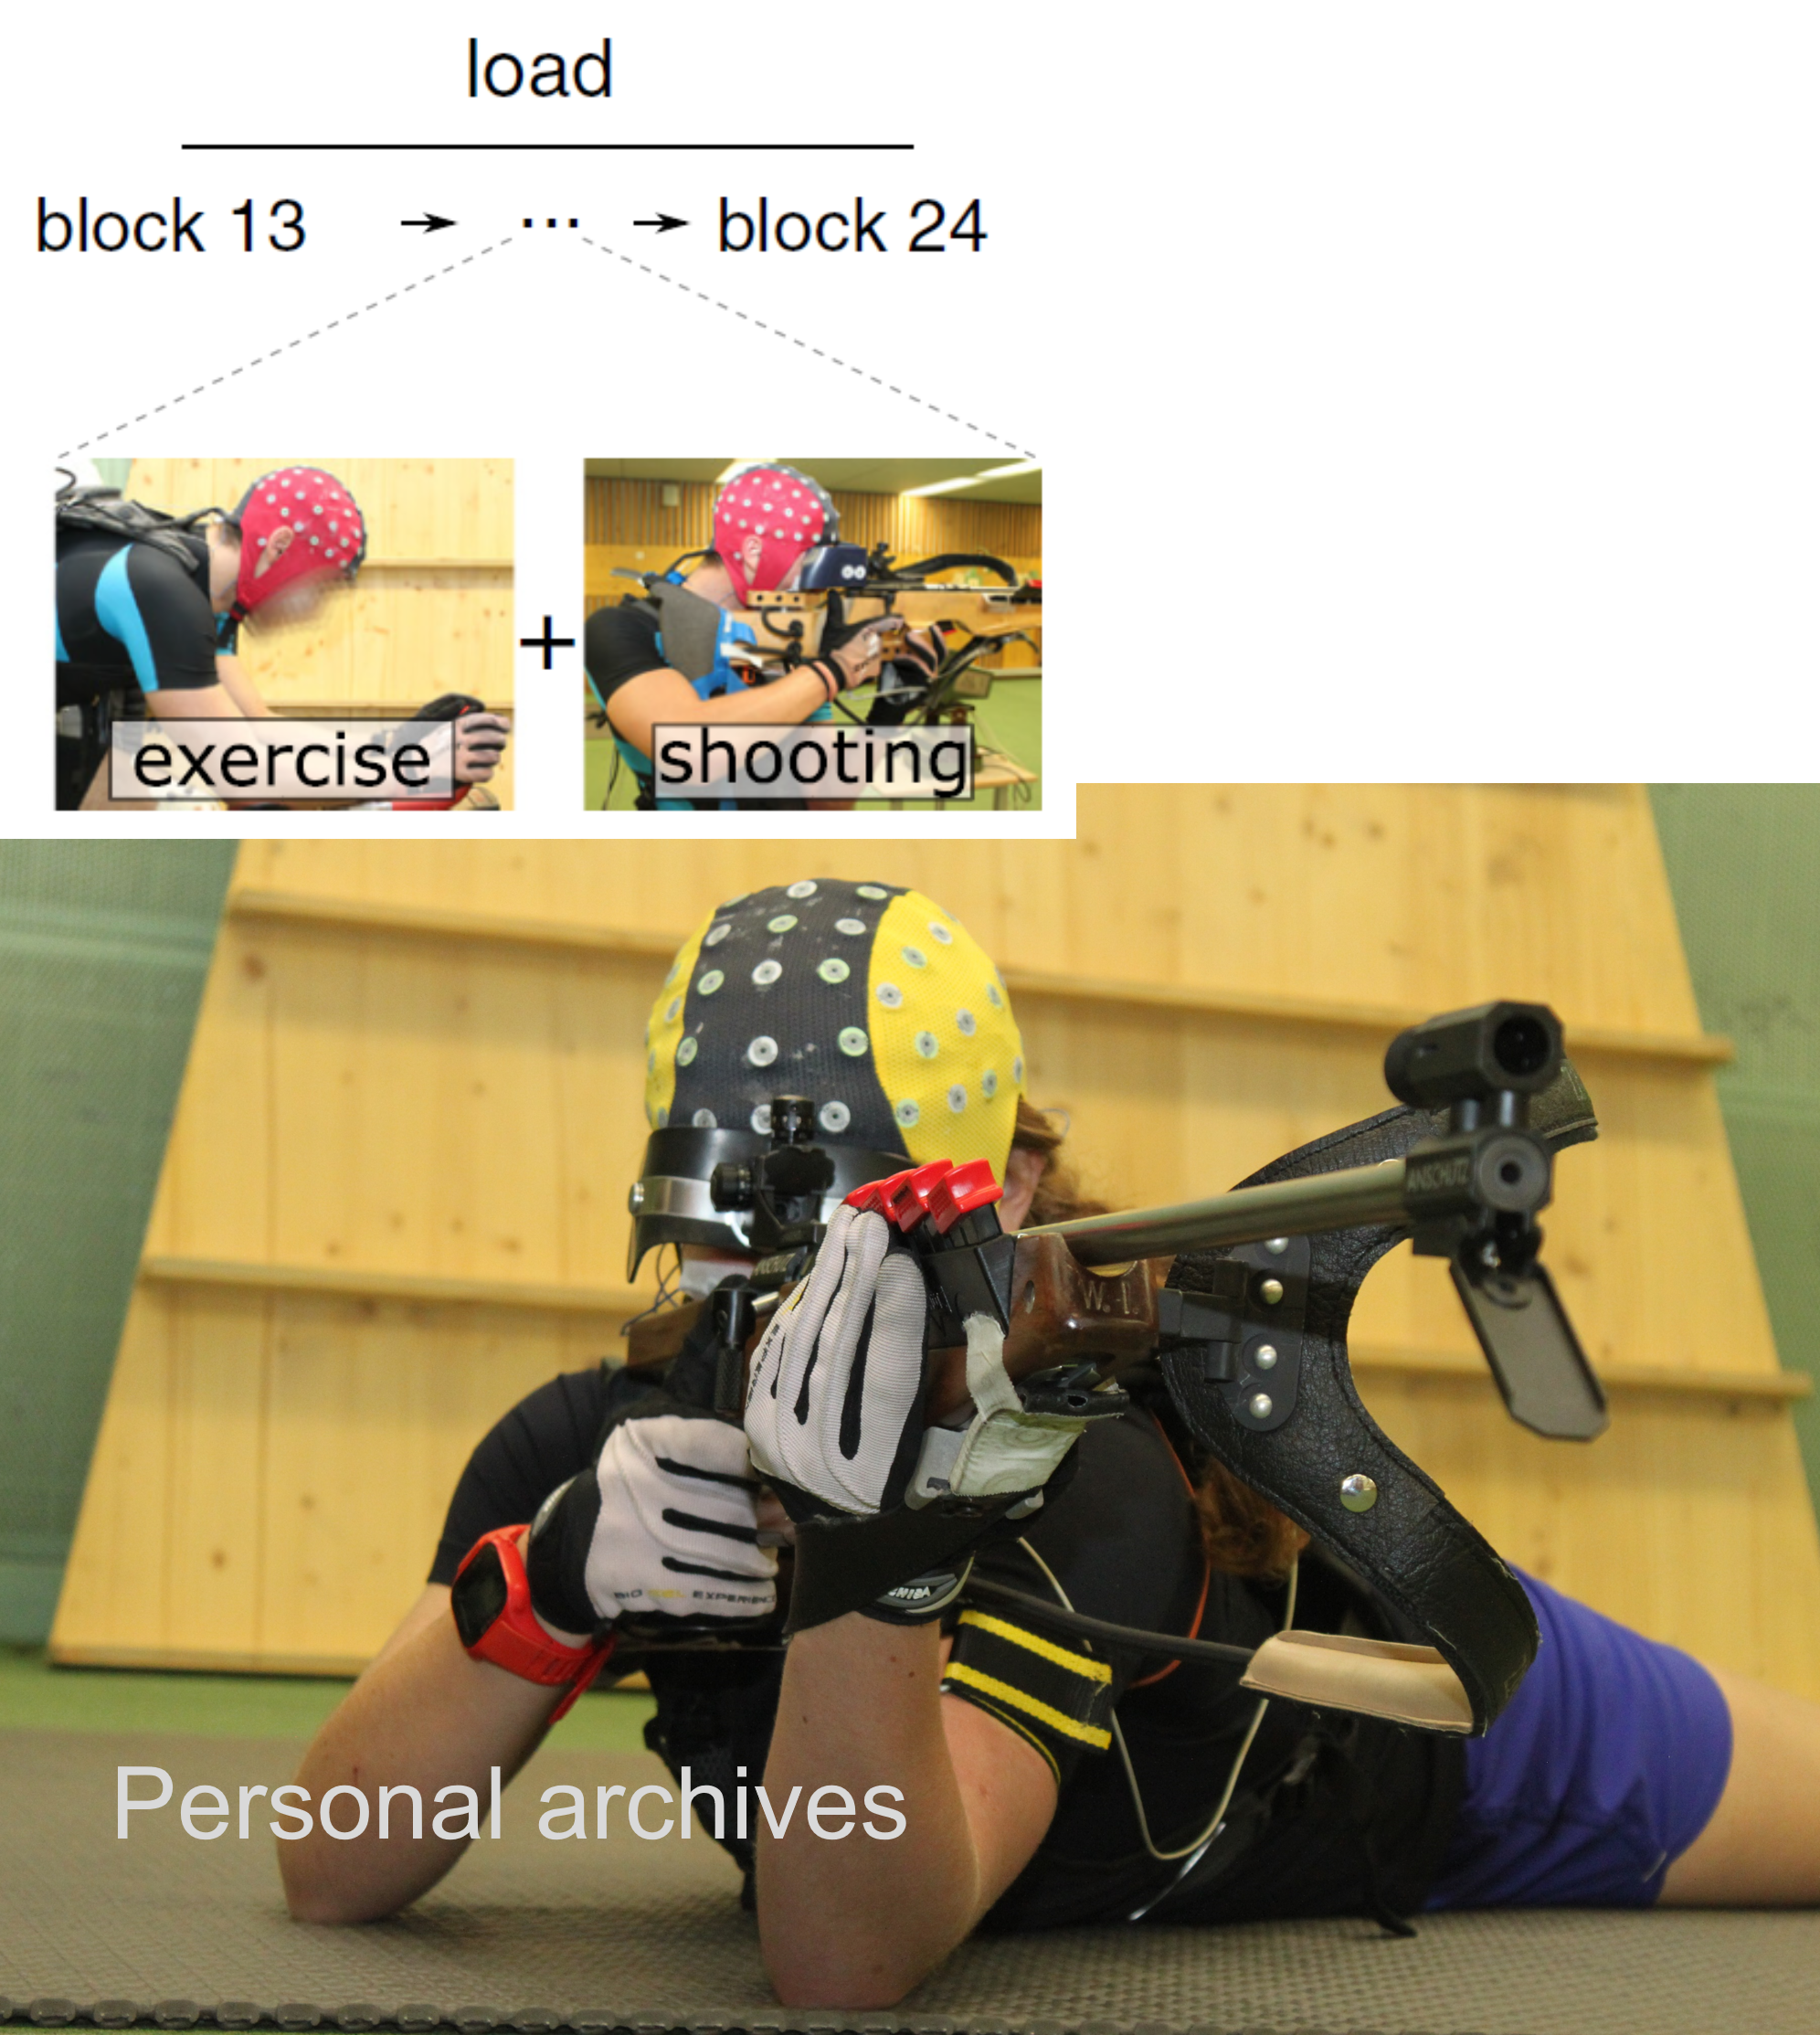
Uses of EEG in sport and exercise